Home /
Expert Answers /
Advanced Physics /
10-pts-below-is-a-sample-from-a-data-set-with-a-graph-of-it-calculate-the-period-for-the-signa-pa214
(Solved): ( 10 pts) Below is a sample from a data set with a graph of it. Calculate the period for the signa ...
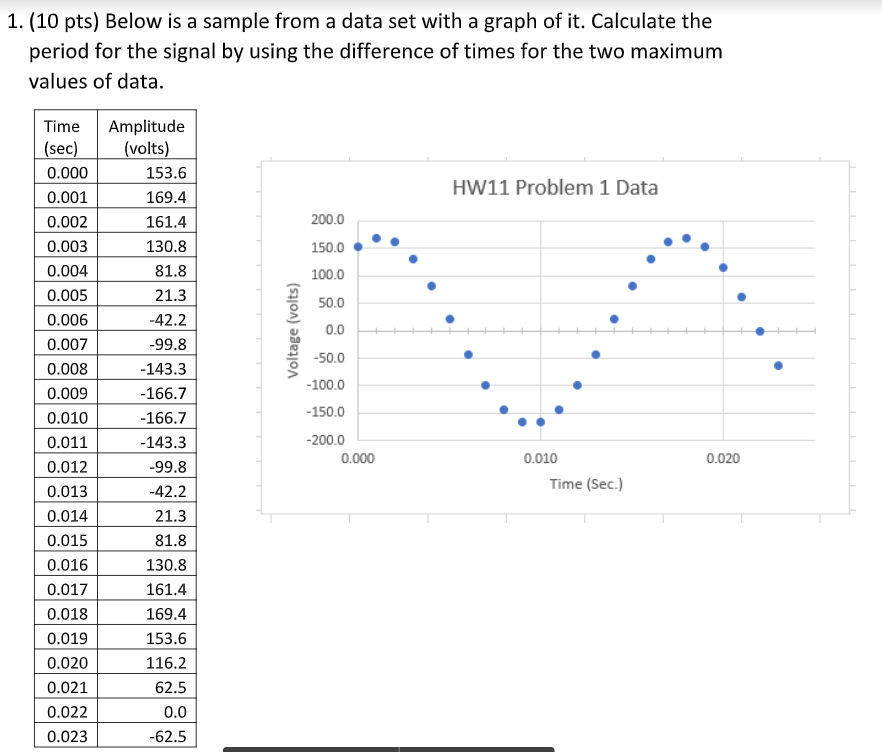
( 10 pts) Below is a sample from a data set with a graph of it. Calculate the period for the signal by using the difference of times for the two maximum
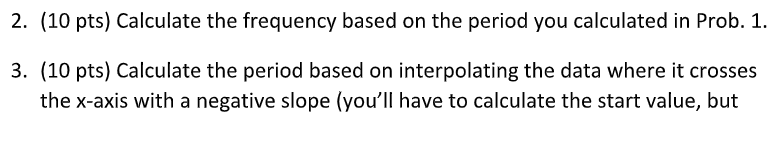
2. (10 pts) Calculate the frequency based on the period you calculated in Prob. 1 . 3. (10 pts) Calculate the period based on interpolating the data where it crosses the \( x \)-axis with a negative slope (you'll have to calculate the start value, but
note, it is close to but not exactly \( t=0.0055 \mathrm{sec} \). By contrast, the end value is exactly \( t=0.022 \) sec.). (10 pts) Calculate the frequency based on calculation in problem 3.
Expert Answer
1. Given the data set with graph. The time period Can be calculated using difference of tim