Home /
Expert Answers /
Electrical Engineering /
2-compute-the-price-index-for-each-year-use-the-first-year-as-the-base-year-what-was-the-inflati-pa578
(Solved): 2. Compute the price index for each year. Use the first year as the base year. What was the inflati ...
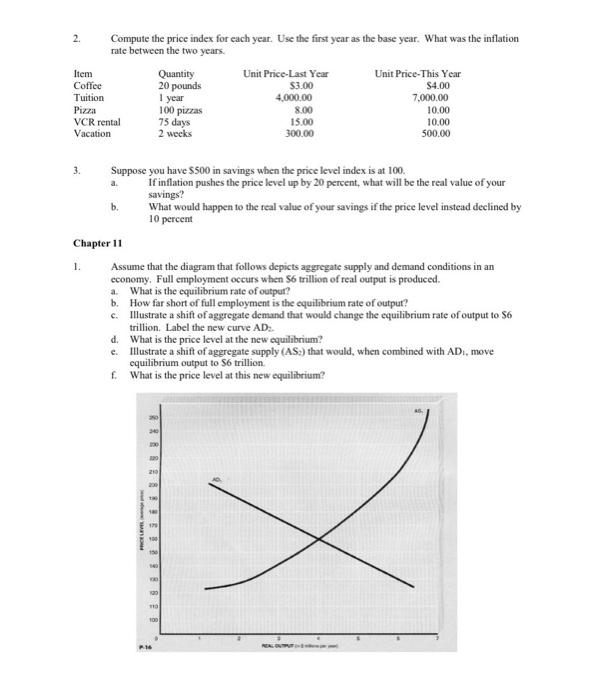
2. Compute the price index for each year. Use the first year as the base year. What was the inflation rate between the two years. 3. Suppose you have in savings when the price level index is at 100 . a. If inflation pushes the price level up by 20 percent, what will be the real value of your savings? b. What would happen to the real value of your savings if the price level instead declined by 10 percent Chapter 11 1. Assume that the diagram that follows depicts aggregate supply and demand conditions in an cconomy. Full employment occurs when 56 trillion of real output is produced. a. What is the equilibrium rate of outpur? b. How far short of full employment is the equilibrium rate of outpur? c. Illustrate a shift of aggregate demund that would change the equilibrium rate of output to trillion. Label the new curve : d. What is the price level at the new equilibrium? c. Illustrate a shift of aggregate supply (AS:) that would, when combined with , move equilibrium output to trillion. f. What is the price level at this new equilibrium?