Home /
Expert Answers /
Economics /
25-20-15-unemployment-probability-10-5-50-25-75-100-high-school-exit-exam-score-in-a-country-outsi-pa715
(Solved): 25 20 15 Unemployment probability 10 5 50 25 75 100 High school exit exam score In a country (outsi ...
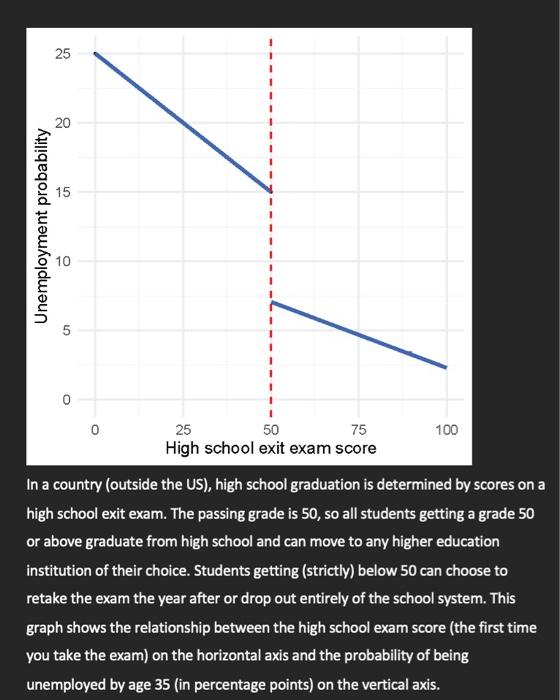
25 20 15 Unemployment probability 10 5 50 25 75 100 High school exit exam score In a country (outside the US), high school graduation is determined by scores on a high school exit exam. The passing grade is 50, so all students getting a grade 50 or above graduate from high school and can move to any higher education institution of their choice. Students getting (strictly) below 50 can choose to retake the exam the year after or drop out entirely of the school system. This graph shows the relationship between the high school exam score (the first time you take the exam) on the horizontal axis and the probability of being unemployed by age 35 (in percentage points) on the vertical axis.
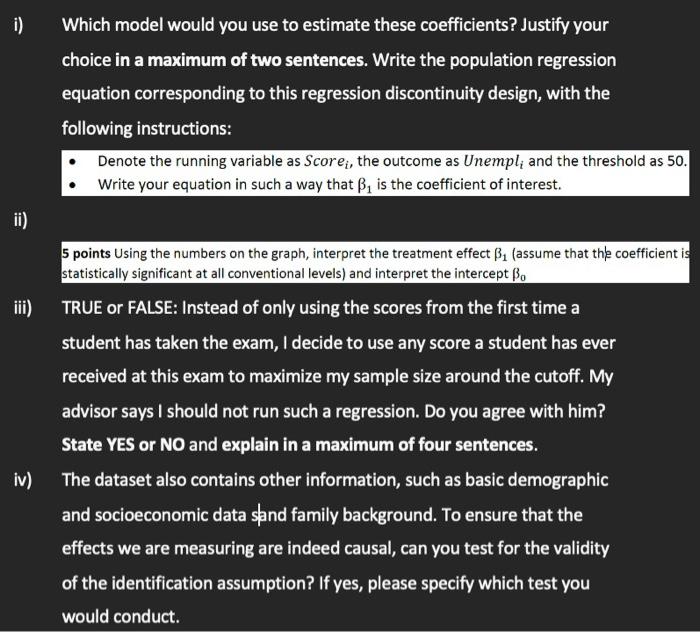
i) Which model would you use to estimate these coefficients? Justify your choice in a maximum of two sentences. Write the population regression equation corresponding to this regression discontinuity design, with the following instructions: Denote the running variable as Score, the outcome as Unempli and the threshold as 50. Write your equation in such a way that B, is the coefficient of interest. ii) iii) 5 points Using the numbers on the graph, interpret the treatment effect B. (assume that the coefficient is statistically significant at all conventional levels) and interpret the intercept Bo TRUE or FALSE: Instead of only using the scores from the first time a student has taken the exam, I decide to use any score a student has ever received at this exam to maximize my sample size around the cutoff. My advisor says I should not run such a regression. Do you agree with him? State YES or NO and explain in a maximum of four sentences. The dataset also contains other information, such as basic demographic and socioeconomic data sand family background. To ensure that the effects we are measuring are indeed causal, can you test for the validity of the identification assumption? If yes, please specify which test you would conduct. iv)
Expert Answer
The least-squares regression line y = b0 + b1x is an estimate of the true population regression line, y = 0 + 1x. This line describes how the mean response y changes with x. The observed values for y vary about their means y and a