Home /
Expert Answers /
Accounting /
3-16-balance-sheet-analysis-a-365-day-in-the-table-that-follows-complete-the-balance-sheet-and-sa-pa661
(Solved): (3-16) Balance Sheet Analysis a 365-day In the table that follows, complete the balance sheet and sa ...
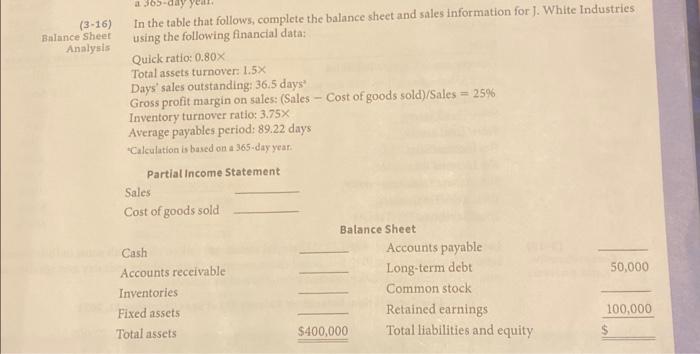
(3-16) Balance Sheet Analysis a 365-day In the table that follows, complete the balance sheet and sales information for J. White Industries using the following financial data: Quick ratio: 0.80X Total assets turnover: 1.5X Days' sales outstanding: 36.5 daysª Gross profit margin on sales: (Sales - Cost of goods sold)/Sales = 25% Inventory turnover ratio: 3.75X Average payables period: 89.22 days "Calculation is based on a 365-day year. Partial Income Statement Sales Cost of goods sold Cash Accounts receivable Inventories Fixed assets Total assets Balance Sheet $400,000 Accounts payable Long-term debt Common stock Retained earnings Total liabilities and equity 50,000 100,000
In the table that follows, complete the balance sheet and sales information for . White Industries using the following financial data: Quick ratio: Total assets turnover: Days' sales outstanding; 36.5 days? Gross profit margin on 5ales: (Sales - Cost of goods sold) Sales Inventory turnover ratio: Average payables period: 89.22 days "Calculation is based on a 365 . day yean.
Expert Answer
Partial Income Statement:Calculation of Sales using Assets turnover ratio:Asset turnover ratio= Sales/ Total Assets 1.5= Sales/ $400,000Sales= 1.5*$400,000Sales= $600,000Given total assets = $400,000 and asset turnover ratio =1.5XCalculation of Cost of goods sold using Gross profit margin:(Sales - COGS)/Sales = 25%$600,000 - COGS/ $600,000 = 25%$600,000 - COGS = 25%*$600,000COGS= $600,000- $150,000COGS= $450,000Consider sales value from above calculation