Home /
Expert Answers /
Statistics and Probability /
3-the-following-data-values-represent-scores-on-a-test-find-the-range-and-standard-deviation-of-t-pa404
(Solved): 3) The following data values represent scores on a test. Find the range and standard deviation of t ...
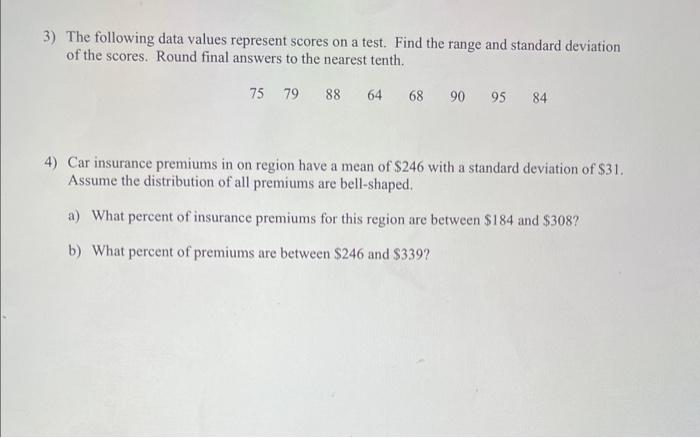
3) The following data values represent scores on a test. Find the range and standard deviation of the scores. Round final answers to the nearest tenth. 4) Car insurance premiums in on region have a mean of \$246 with a standard deviation of \$31. Assume the distribution of all premiums are bell-shaped. a) What percent of insurance premiums for this region are between \( \$ 184 \) and \( \$ 308 \) ? b) What percent of premiums are between \( \$ 246 \) and \( \$ 339 \) ?
Expert Answer
Calculate Sample Standard deviation (S) from the following data 75,79,88,64,68,90,95,84 Solution: x dx d