Home /
Expert Answers /
Calculus /
4-13-points-details-a-estimate-the-area-under-the-graph-of-f-x-2-2x-from-x-1-to-x-pa230
(Solved): 4. [-/13 Points] DETAILS (a) Estimate the area under the graph of f(x) = 2 + 2x from x = -1 to x ...
![4. [-/13 Points]
DETAILS
(a) Estimate the area under the graph of f(x) = 2 + 2x² from x = -1 to x = 2 using three rectangles](https://media.cheggcdn.com/media/9b5/9b5db4ba-5ed0-4178-a2c6-c2113e9e661d/phpWYIyf5)
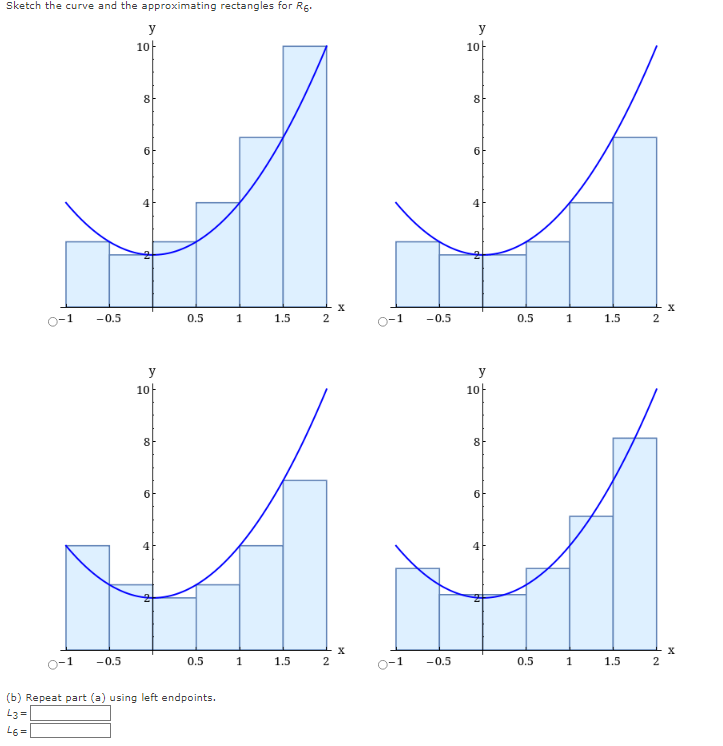
4. [-/13 Points] DETAILS (a) Estimate the area under the graph of f(x) = 2 + 2x² from x = -1 to x = 2 using three rectangles and right endpoints. R3 = Then improve your estimate by using six rectangles. R6 = Sketch the curve and the approximating rectangles for R3. y y 0-1 0-1 10 8 y 10+ 8 6 1 1 2 2 X X 0-1 0-1 10 8 6 4 y 10 8 6 1 1 2 2 X X
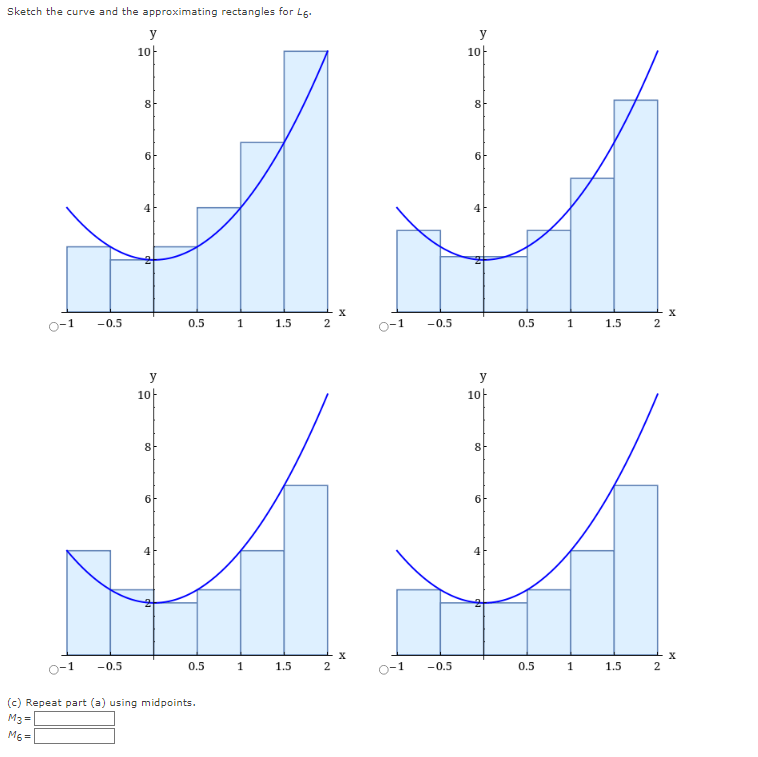
Sketch the curve and the approximating rectangles for R6. y y 10 10 8 8 6 6 Hu X X 0-1 -0.5 0.5 1.5 2 -0.5 0.5 1 y 10 8 6 4 1 -0.5 0.5 (b) Repeat part (a) using left endpoints. 43= 46= 1 1 1.5 2 X 0-1 0-1 -0.5 y 10 8 0.5 1 1.5 1.5 2 2 X
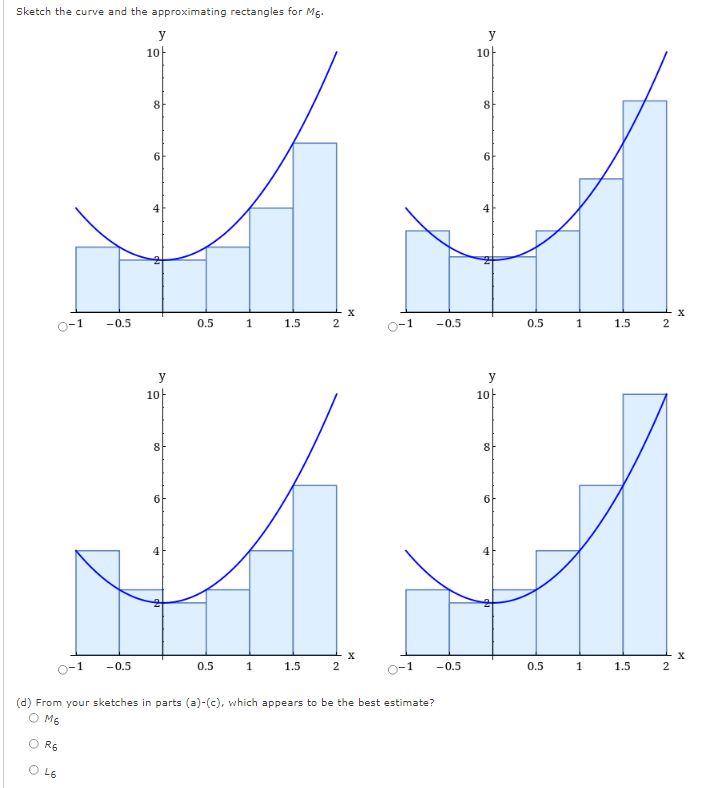
Sketch the curve and the approximating rectangles for 15- ? 10+ y 10+ 8 8 6 6 X X 0-1 -0.5 0.5 1 1.5 2 0-1 -0.5 0.5 1 1 1.5 2 2 y 10+ 10+ 8 8 8 6 6 ? 0-1 -0.5 0.5 1 1.5 2 0-1 -0.5 0.5 1 1.5 ? 2 2 (c) Repeat part (a) using midpoints. M3= M6 =
Sketch the curve and the approximating rectangles for M6. y y 10 10 8 8 6 MM -0.5 0.5 1.5 0-1 -0.5 0.5 1 1.5 2 y 10 y 10 8 8 H 6 X 0.5 1 6 L6 1 2 X -0.5 -0.5 -1 0.5 1 1.5 2 (d) From your sketches in parts (a)-(c), which appears to be the best estimate? M6 O R6 X 1.5 2 X