(Solved): 5. Deriving the short-run supply curve Analyze the following price-taker market for protein bars. T ...
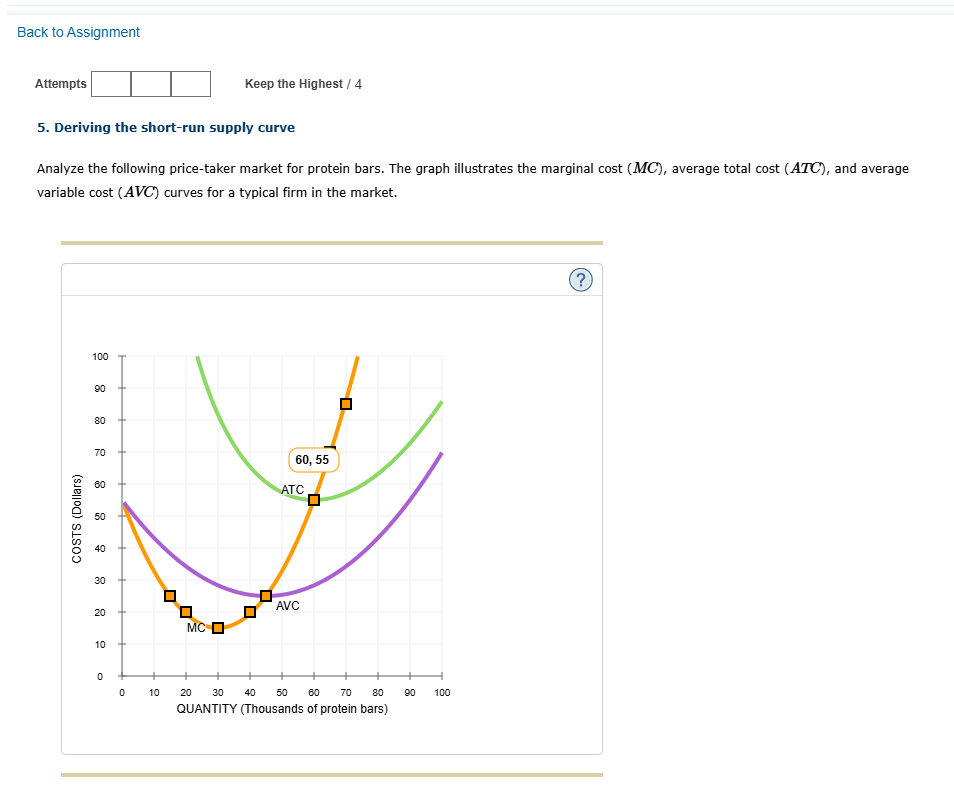
5. Deriving the short-run supply curve Analyze the following price-taker market for protein bars. The graph illustrates the marginal cost (MCMC), average total cost (ATCATC), and average variable cost (AVCAVC) curves for a typical firm in the market. 01020304050607080901001009080706050403020100COSTS (Dollars)QUANTITY (Thousands of protein bars)MCATCAVC60, 55 For each price in the following table, use the graph to determine the number of protein bars this firm would produce in order to maximize its profit. Assume that when the price is exactly equal to the average variable cost, the firm is indifferent between producing zero protein bars and the profit-maximizing quantity. Also, indicate whether the firm will produce, shut down, or be indifferent between the two in the short run. Lastly, determine whether the firm will make a profit, suffer a loss, or break even at each price. Price Quantity Produce or Shut Down? Profit or Loss? (Dollars per protein bar) (Protein bars) 1530,000 Shut down Loss 2040,000 Shut down Loss 2545,000 Either shut down or produce Loss 5560,000 Produce Break even 7065,000 Produce Profit 8570,000 Produce Profit On the following graph, use the orange points (square symbol) to plot points along the portion of the firm’s short-run supply curve that corresponds to prices where there is positive output. (Note: You are given more points to plot than you need.) Firm’s Short-Run Supply01020304050607080901001009080706050403020100PRICE (Dollars per protein bar)QUANTITY (Thousands of protein bars)60, 55 Suppose there are 5 firms in this market, each of which has the cost curves previously shown. On the following graph, use the orange points (square symbol) to plot points along the portion of the market short-run supply curve that corresponds to prices where there is positive output. (Note: You are given more points to plot than you need.) Then, place the black point (plus symbol) on the graph to indicate the short-run equilibrium price and quantity in this market. Market Short-Run SupplyEquilibrium0501001502002503003504004505001009080706050403020100PRICE (Dollars per protein bar)QUANTITY (Thousands of protein bars)Demand At the current short-run market price, firms will in the short run. In the long run, . Grade It Now Save & Continue Continue without saving Back to Assignment Attempts \( \square \) Keep the Highest / 4 5. Deriving the short-run supply curve Analyze the following price-taker market for protein bars. The graph illustrates the marginal cost ( \( M C \) ), average total cost ( \( A T C \) ), and average variable cost (AVC) curves for a typical firm in the market.