(Solved): (#65026933) Consider the points A(10,-3,5) and B(-3,-1,14). a) Determine the vector equation of the ...
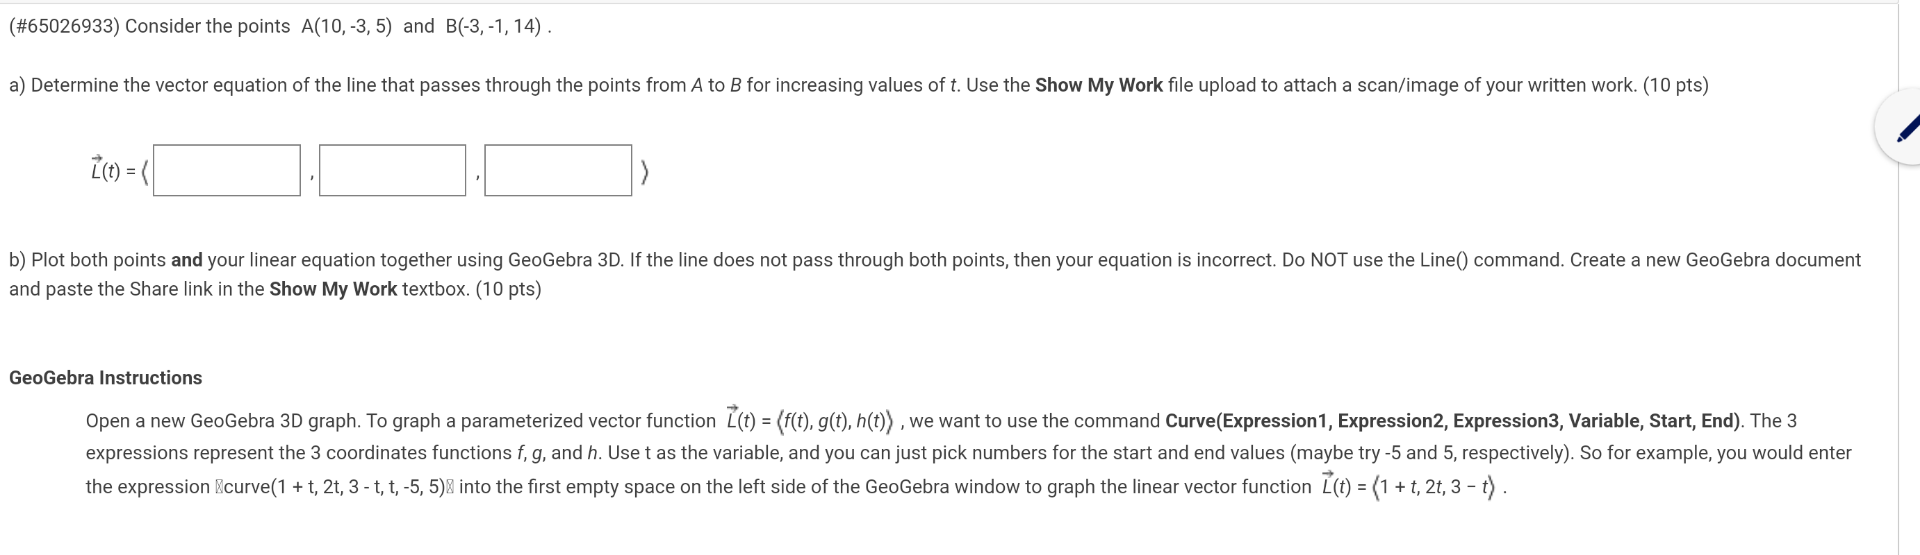
(#65026933) Consider the points
A(10,-3,5)and
B(-3,-1,14). a) Determine the vector equation of the line that passes through the points from
Ato
Bfor increasing values of
t. Use the Show My Work file upload to attach a scan/image of your written work. (10 pts)
vec(L)(t)=(:,|(
,:)|) b) Plot both points and your linear equation together using GeoGebra 3D. If the line does not pass through both points, then your equation is incorrect. Do NOT use the Line() command. Create a new GeoGebra document and paste the Share link in the Show My Work textbox. (10 pts) GeoGebra Instructions Open a new GeoGebra 3D graph. To graph a parameterized vector function
vec(L)(t)=(:f(t),g(t),h(t):), we want to use the command Curve(Expression1, Expression2, Expression3, Variable, Start, End). The 3 expressions represent the 3 coordinates functions
f,g, and
h. Use
tas the variable, and you can just pick numbers for the start and end values (maybe try -5 and 5 , respectively). So for example, you would enter the expression
Bcurve
(1+t,2t,3-t,t,-5,5)⊠into the first empty space on the left side of the GeoGebra window to graph the linear vector function
vec(L)(t)=(:1+t,2t,3-t:).