Home /
Expert Answers /
Statistics and Probability /
84-given-the-following-box-plot-0-2-10-figure-2-41-a-which-quarter-has-the-smallest-spread-of-pa847
(Solved): 84. Given the following box plot: + 0 2 10 Figure 2.41 a. which quarter has the smallest spread of ...
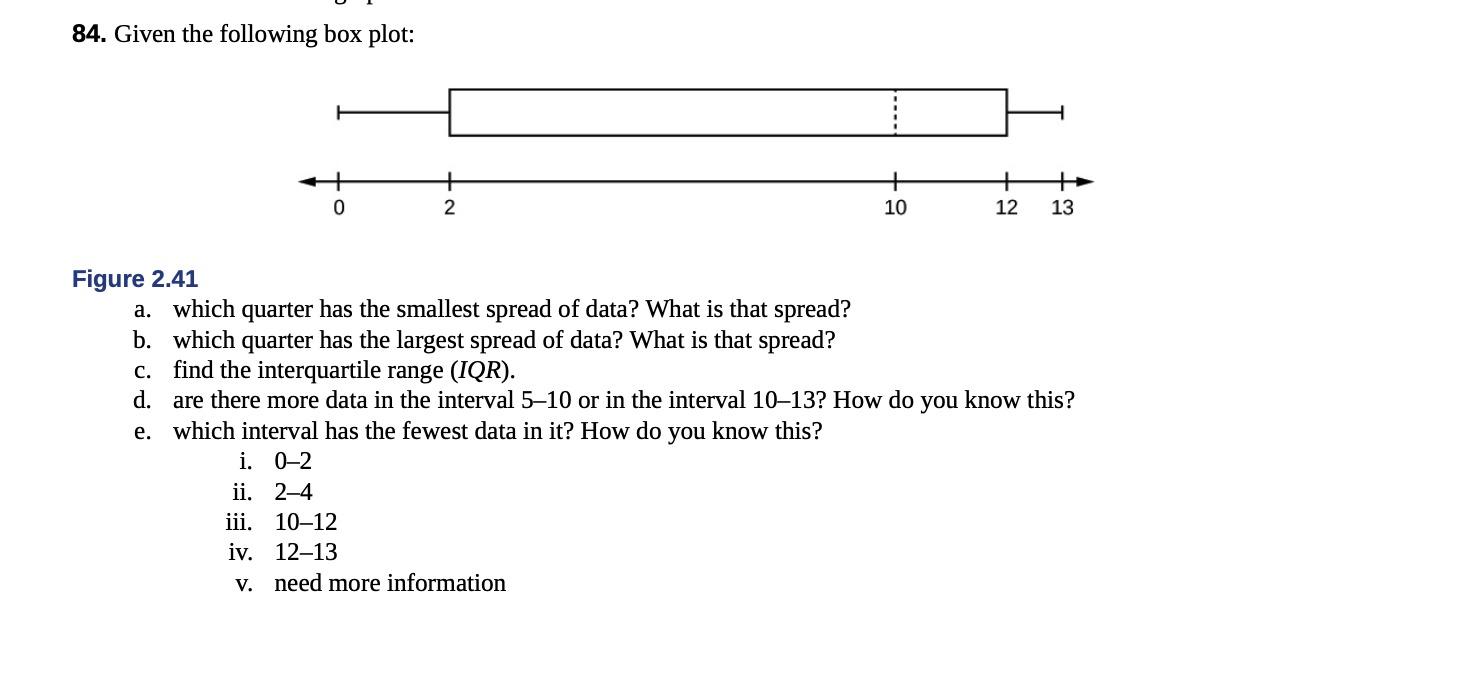
84. Given the following box plot: + 0 2 10 Figure 2.41 a. which quarter has the smallest spread of data? What is that spread? b. which quarter has the largest spread of data? What is that spread? c. find the interquartile range (IQR). d. are there more data in the interval 5-10 or in the interval 10-13? How do you e. which interval has the fewest data in it? How do you know this? i. 0-2 ii. 2-4 iii. 10-12 iv. 12-13 v. need more information + 12 13 know this?