Home /
Expert Answers /
Operations Management /
a-design-engineer-wants-to-construct-a-sample-mean-chart-for-controlling-the-diameter-for-a-compon-pa512
(Solved): A design engineer wants to construct a sample mean chart for controlling the diameter for a compon ...
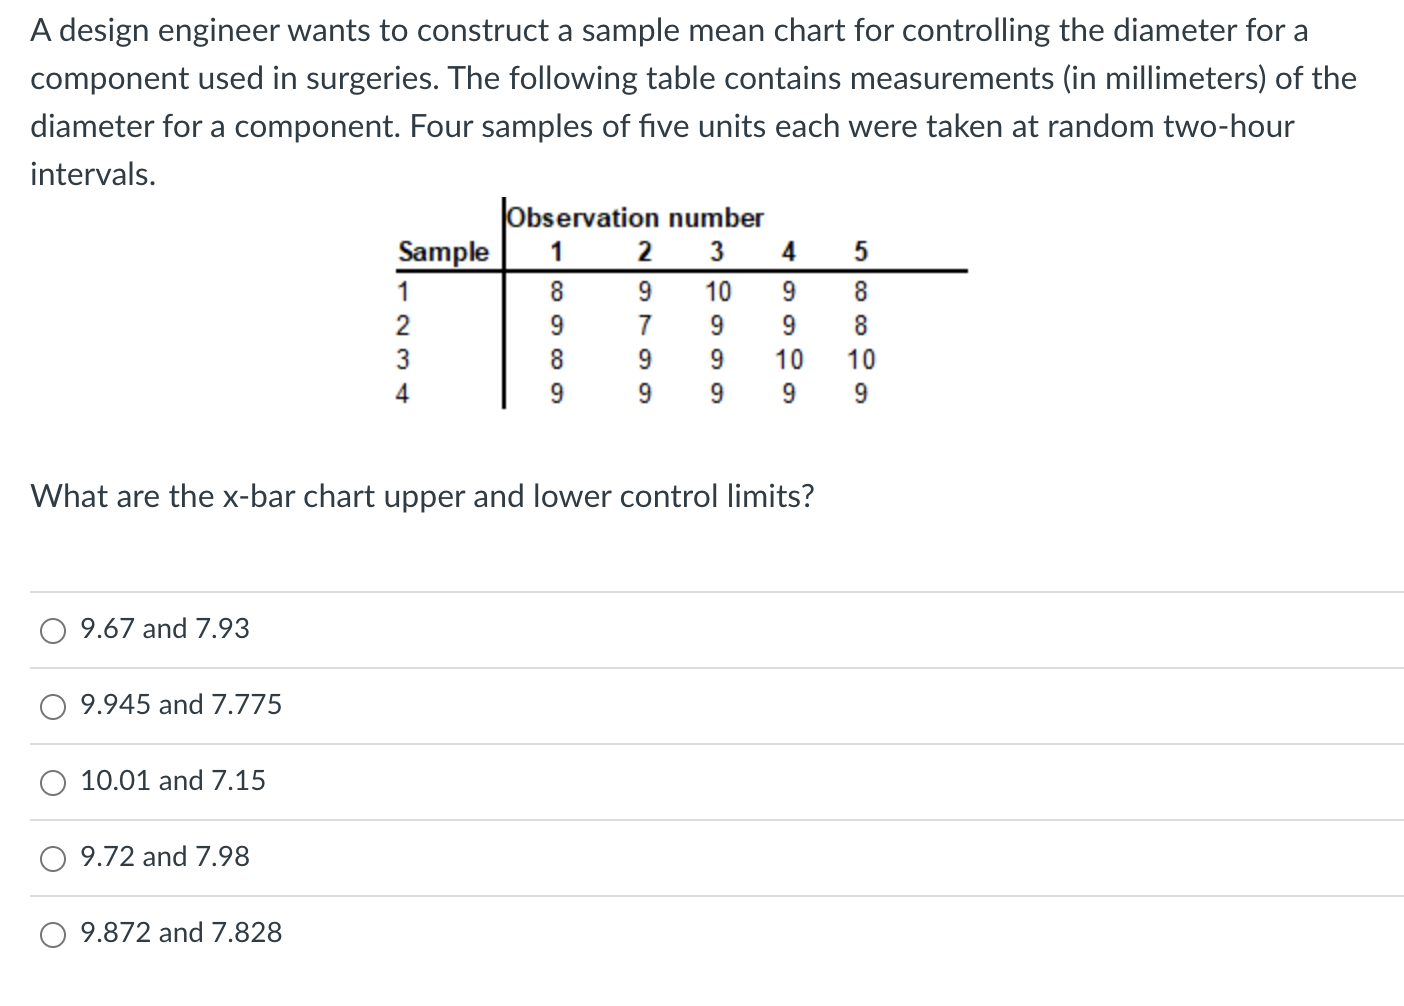
A design engineer wants to construct a sample mean chart for controlling the diameter for a component used in surgeries. The following table contains measurements (in millimeters) of the diameter for a component. Four samples of five units each were taken at random two-hour intervals. What are the \( x \)-bar chart upper and lower control limits? \( 9.67 \) and \( 7.93 \) \( 9.945 \) and \( 7.775 \) \( 10.01 \) and \( 7.15 \) \( 9.72 \) and \( 7.98 \) \( 9.872 \) and \( 7.828 \)