Home /
Expert Answers /
Other Math /
a-determine-the-25th-50th-and-75th-percentiles-for-the-hypothetical-test-scores-shown-in-the-do-pa163
(Solved): (a) Determine the 25th, 50th, and 75th percentiles for the hypothetical test scores shown in the do ...
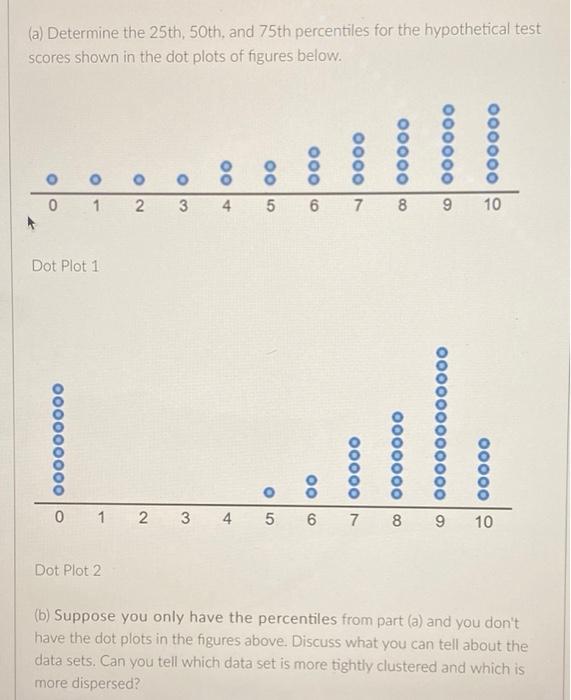
(a) Determine the 25th, 50th, and 75th percentiles for the hypothetical test scores shown in the dot plots of figures below. o Ooooooo O OO Oooooo | 000000 VOOOO OOOO onloo ???? 0 1 2 3 4. 5 6 7 8 10 Dot Plot 1 ooooooooo ooooooo vooooo oo 0000000000000 oooooo ono 0 1 2 3 4 5 6 7 00 9 10 Dot Plot 2 (b) Suppose you only have the percentiles from part (a) and you don't have the dot plots in the figures above. Discuss what you can tell about the data sets. Can you tell which data set is more tightly clustered and which is more dispersed?
Expert Answer
a) We have to find the 25th, 50th and 75th percentile for the dot plots 1 and dot plot 2. Dot plot 1: A dot plot, also known as a strip plot or dot chart, is a simple form of data visualization that consists of data points plotted as dots on a graph