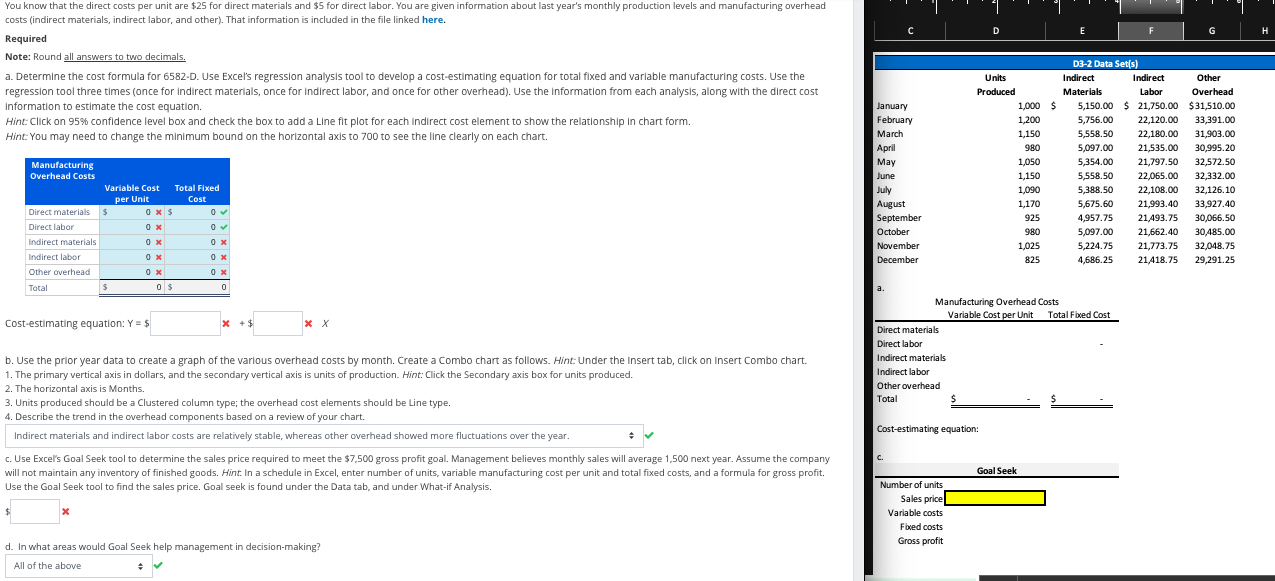
(Solved): a)Determine the cost formula for 6582-D. Use Excels regression analysis tool to develop a cost-es ...
a)Determine the cost formula for 6582-D. Use Excel’s regression analysis tool to develop a cost-estimating equation for total fixed and variable manufacturing costs. Use the regression tool three times (once for indirect materials, once for indirect labor, and once for other overhead). Use the information from each analysis, along with the direct cost information to estimate the cost equation. Hint: Click on 95% confidence level box and check the box to add a Line fit plot for each indirect cost element to show the relationship in chart form. Hint: You may need to change the minimum bound on the horizontal axis to 700 to see the line clearly on each chart. Cost-estimating equation: Y = X b. Use the prior year data to create a graph of the various overhead costs by month. Create a Combo chart as follows. Hint: Under the Insert tab, click on Insert Combo chart. 1. The primary vertical axis in dollars, and the secondary vertical axis is units of production. Hint: Click the Secondary axis box for units produced. 2. The horizontal axis is Months. 3. Units produced should be a Clustered column type; the overhead cost elements should be Line type. 4. Describe the trend in the overhead components based on a review of your chart. Answer Indirect materials and indirect labor costs are relatively stable, whereas other overhead showed more fluctuations over the year. c. Use Excel’s Goal Seek tool to determine the sales price required to meet the $7,500 gross profit goal. Management believes monthly sales will average 1,500 next year. Assume the company will not maintain any inventory of finished goods. Hint: In a schedule in Excel, enter number of units, variable manufacturing cost per unit and total fixed costs, and a formula for gross profit. Use the Goal Seek tool to find the sales price. Goal seek is found under the Data tab, and under What-if Analysis