Home /
Expert Answers /
Economics /
a-draw-a-graph-at-the-firm-level-to-show-the-equilibrium-quantity-at-the-intersection-of-the-marg-pa567
(Solved): a) Draw a graph at the firm level to show the equilibrium quantity at the intersection of the Marg ...
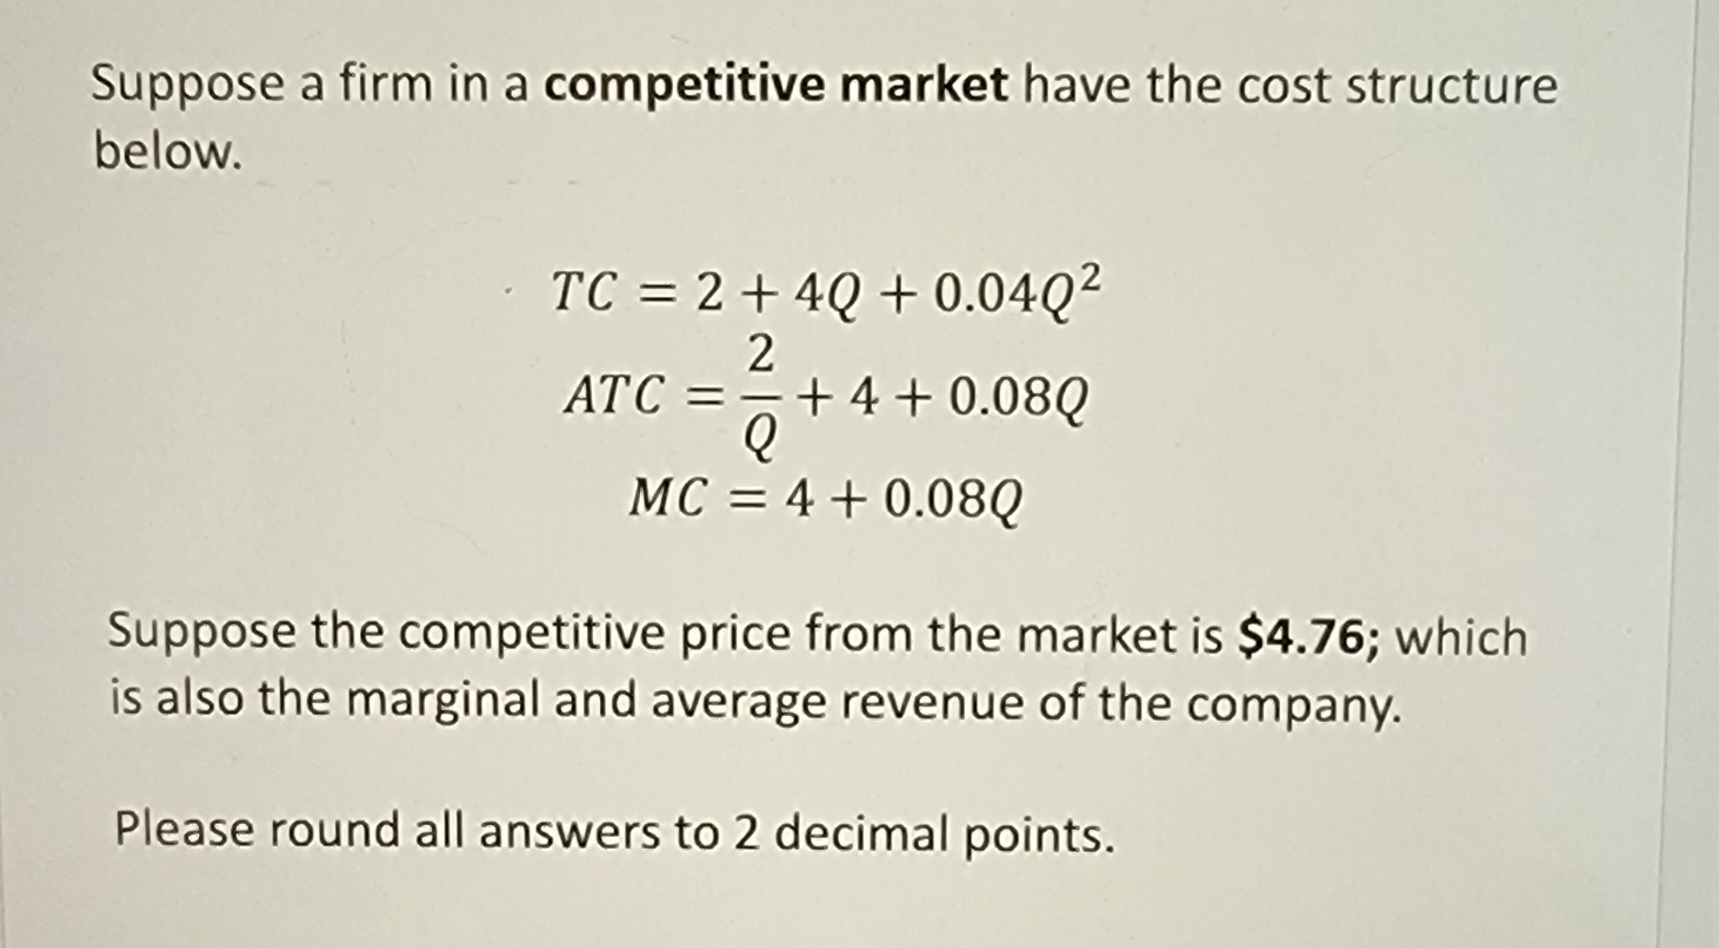
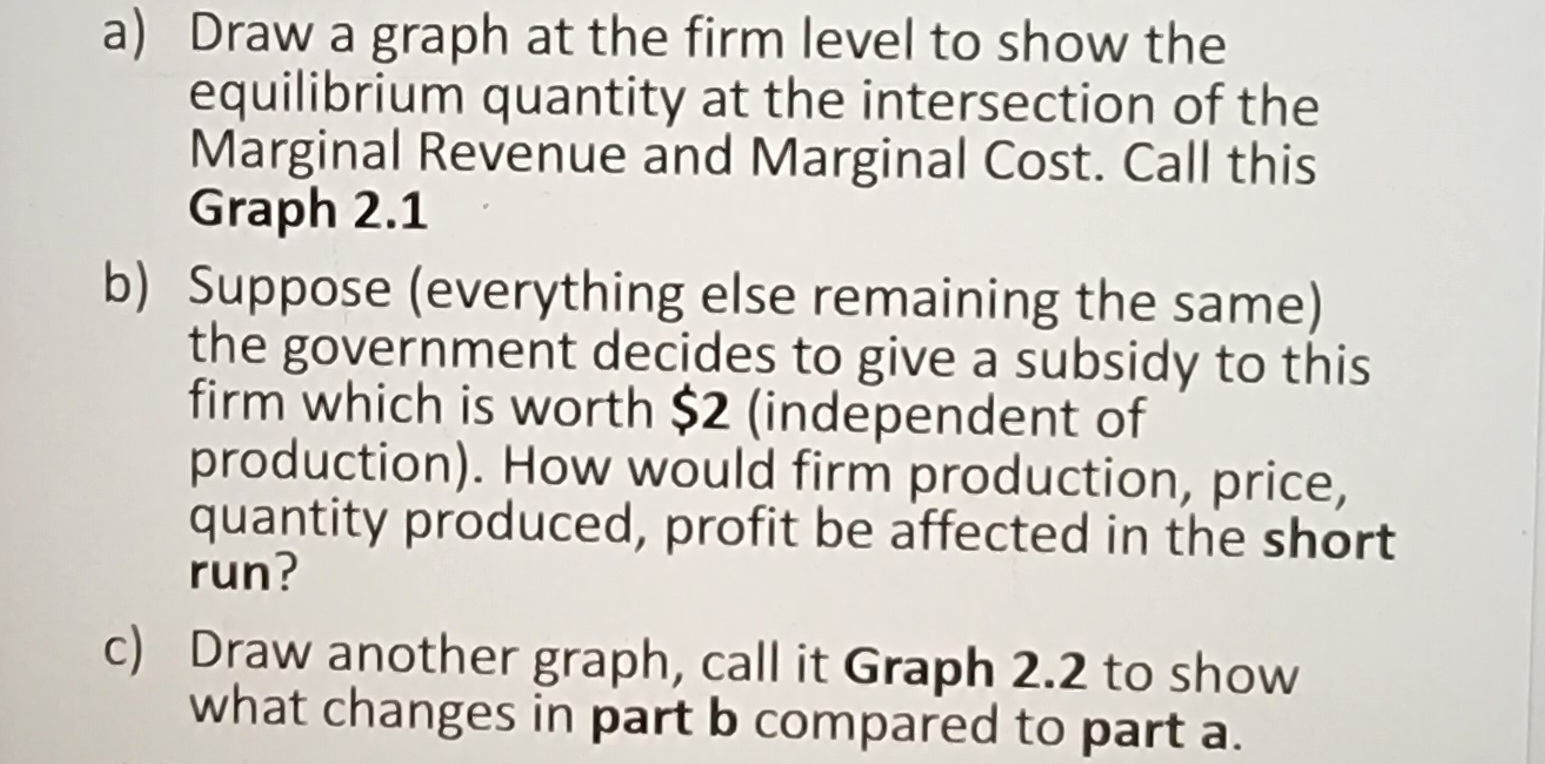
a) Draw a graph at the firm level to show the equilibrium quantity at the intersection of the Marginal Revenue and Marginal Cost. Call this Graph 2.1 b) Suppose (everything else remaining the same) the government decides to give a subsidy to this firm which is worth $2 (independent of production). How would firm production, price, quantity produced, profit be affected in the short run? c) Draw another graph, call it Graph 2.2 to show what changes in part b compared to part a.