Home /
Expert Answers /
Computer Science /
a-plot-a-graph-of-a-cone-of-height-3-and-radius-1-use-the-parametrization-x-r-cos-theta-pa183
(Solved): (a) Plot a graph of a cone of height 3 and radius 1. Use the parametrization \( x=r \cos \theta, \ ...
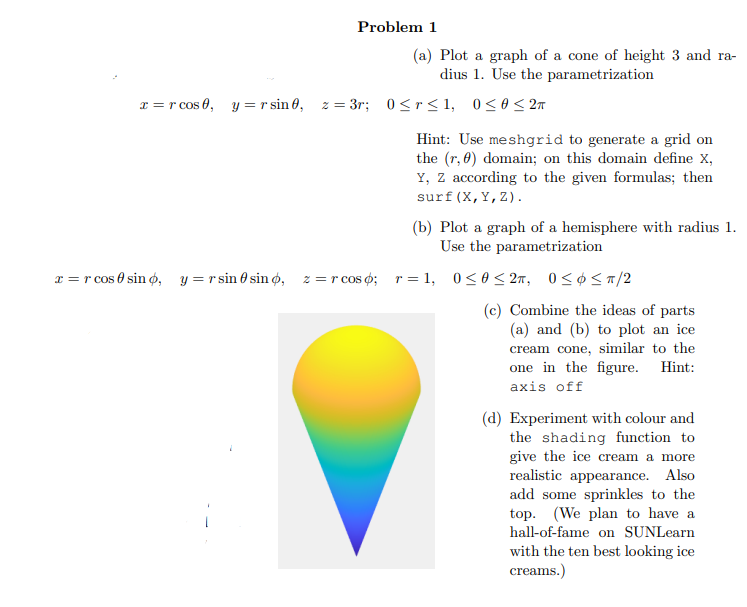
(a) Plot a graph of a cone of height 3 and radius 1. Use the parametrization \( x=r \cos \theta, \quad y=r \sin \theta, \quad z=3 r ; \quad 0 \leq r \leq 1, \quad 0 \leq \theta \leq 2 \pi \) Hint: Use meshgrid to generate a grid on the \( (r, \theta) \) domain; on this domain define \( \mathrm{X} \), \( \mathrm{Y}, \mathrm{Z} \) according to the given formulas; then \( \operatorname{surf}(X, Y, Z) \). (b) Plot a graph of a hemisphere with radius 1 . Use the parametrization \( x=r \cos \theta \sin \phi, \quad y=r \sin \theta \sin \phi, \quad z=r \cos \phi ; \quad r=1, \quad 0 \leq \theta \leq 2 \pi, \quad 0 \leq \phi \leq \pi / 2 \) (c) Combine the ideas of parts (a) and (b) to plot an ice cream cone, similar to the one in the figure. Hint: axis off (d) Experiment with colour and the shading function to give the ice cream a more realistic appearance. Also add some sprinkles to the top. (We plan to have a with the ten best looking ice creams.)
Expert Answer
a) Code: % Create meshgrid for r & theta [r, th] = meshgrid(linspace(0, 1), linspace(0, 2*pi)); % Compute x, y & z using given equations x = r.*cos(th); y = r.*sin(th); z = 3*r; % Plot the cone surf(x, y, z); Code Snapshots: Output: ------------