Home /
Expert Answers /
Chemistry /
a-plot-of-the-data-reveals-the-following-graph-indicate-which-of-the-following-are-reasonable-conc-pa471
(Solved): A plot of the data reveals the following graph. Indicate which of the following are reasonable conc ...
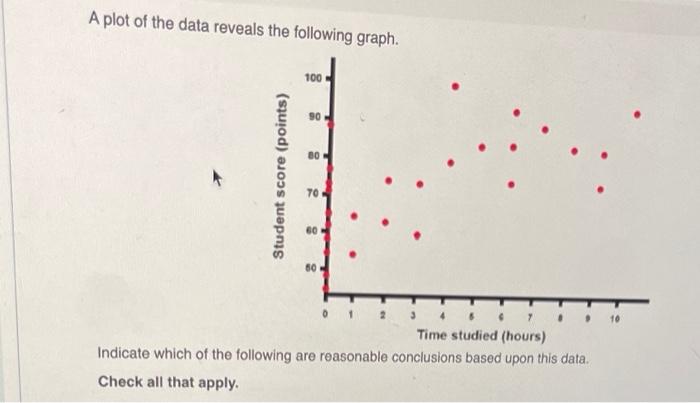
A plot of the data reveals the following graph. Indicate which of the following are reasonable conclusions based upon this data. Check all that apply.
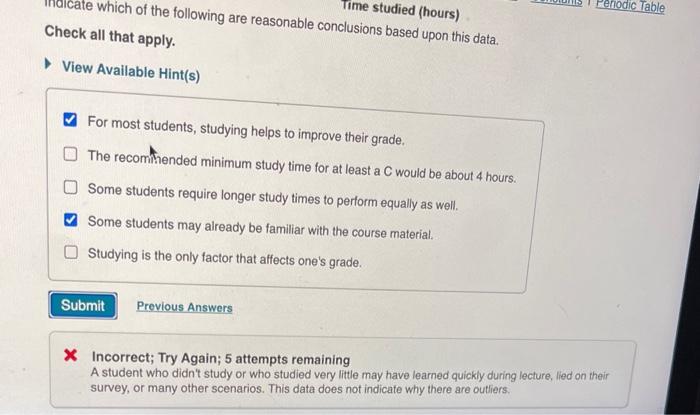
Time studied (hours) Check all that apply. View Available Hint(s) For most students, studying helps to improve their grade. The recomthended minimum study time for at least a \( \mathrm{C} \) would be about 4 hours. Some students require longer study times to perform equally as well. Some students may already be familiar with the course material. Studying is the only factor that affects one's grade. X Incorrect; Try Again; 5 attempts remaining A student who didn't study or who studied very little may have learned quickly during lecture, lied on their survey, or many other scenarios. This data does not indicate why there are outliers.
Expert Answer
After looking at the data, one can choose following points, 1. Studying helps to improve their grade as when studying hours in