Home /
Expert Answers /
Statistics and Probability /
a-random-sample-of-1636-texas-government-employees-were-selected-for-a-study-on-race-the-table-be-pa288
(Solved): A random sample of 1636 Texas government employees were selected for a study on race. The table be ...
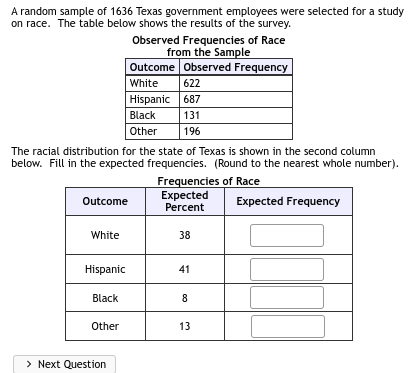
A random sample of 1636 Texas government employees were selected for a study on race. The table below shows the results of the survey. Observed Frequencies of Race from the Samble The racial distribution for the state of Texas is shown in the second column below. Fill in the expected frequencies. (Round to the nearest whole number).
Expert Answer
expected frequency is calculated as n×p where p