Home /
Expert Answers /
Statistics and Probability /
a-use-a-percent-frequency-distribution-to-summarize-these-data-what-do-these-summaries-indicate-pa618
(Solved): (a) Use a percent frequency distribution to summarize these data. What do these summaries indicate ...
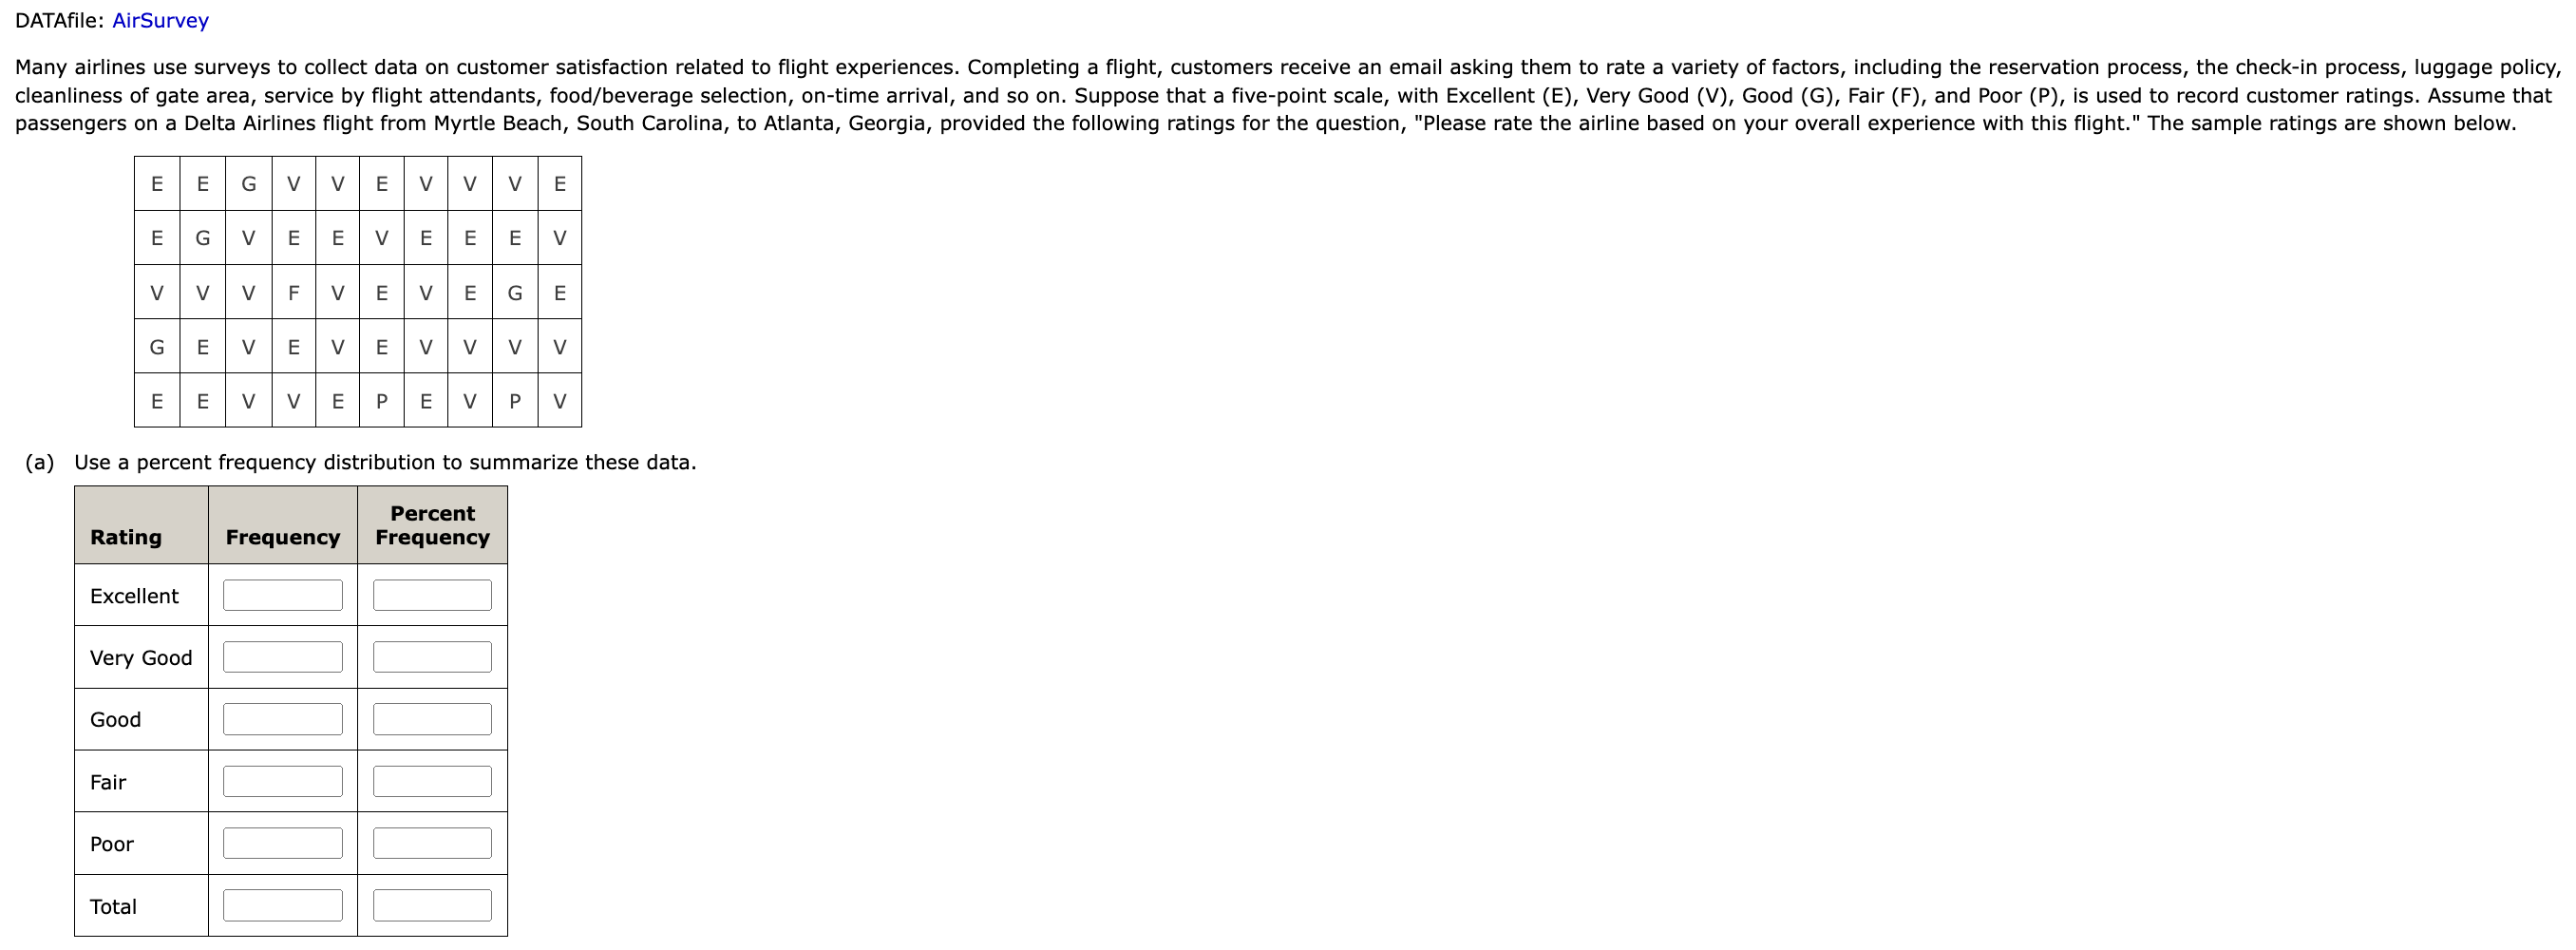
(a) Use a percent frequency distribution to summarize these data.
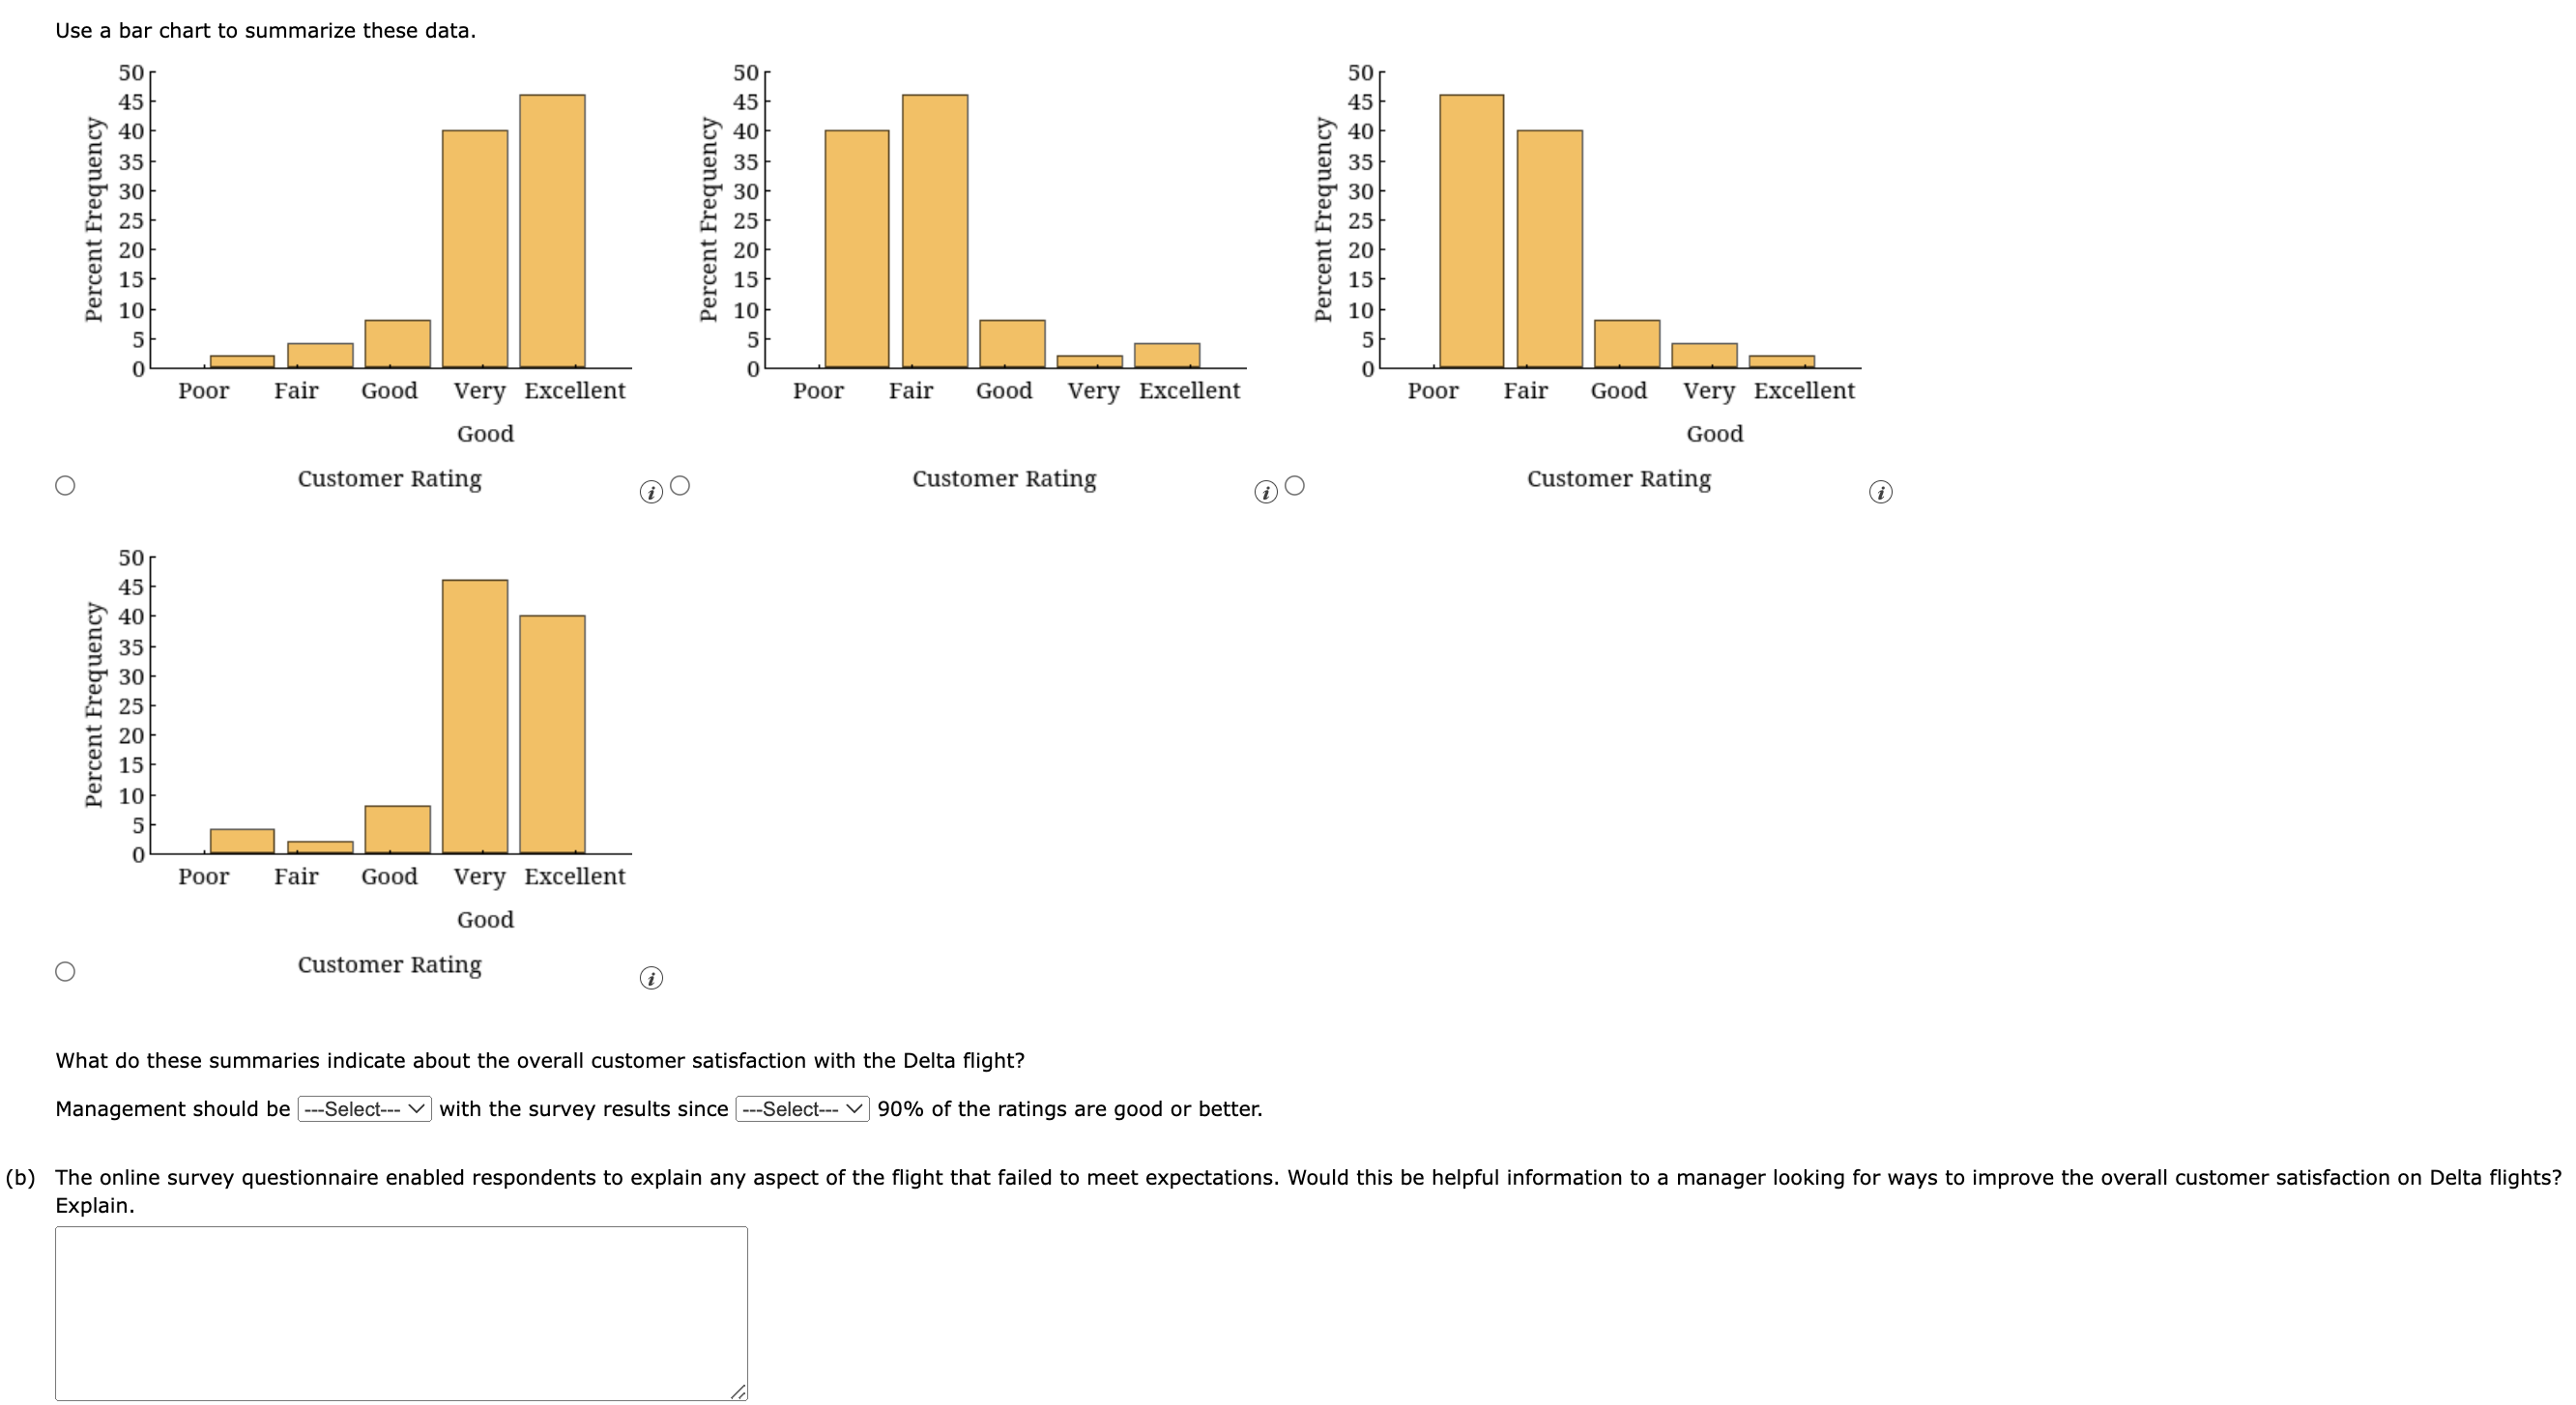
What do these summaries indicate about the overall customer satisfaction with the Delta flight? Management should be with the survey results since of the ratings are good or better. Explain.
Expert Answer
From the given data we can create a frequency distribution table;First , let’s define frequnecy and relative frequencyA frequency distribution table is a way to summarize and present data in a compact form. It shows the number of times each value or range of values in a data set occurs.Frequency: This is the number of times a particular data point or a group of data points appear in the set.