Home /
Expert Answers /
Statistics and Probability /
americans-spend-nearly-7-billion-on-halloween-costumes-and-decorations-sample-data-showin-pa979
(Solved): Americans spend nearly \( \$ 7 \) billion on Halloween costumes and decorations. Sample data showin ...
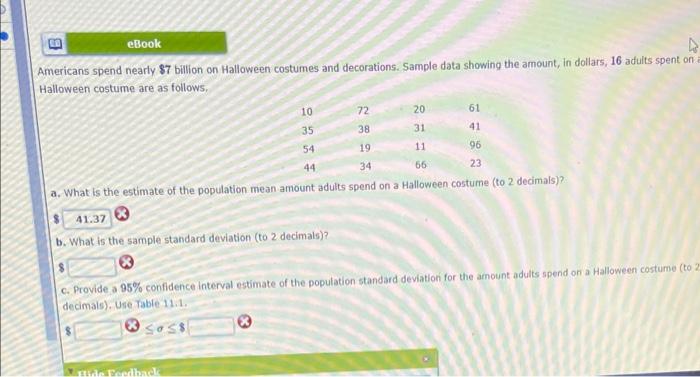
Americans spend nearly \( \$ 7 \) billion on Halloween costumes and decorations. Sample data showing the amount, in dollars, 16 adults spent on Halloween costume are as follows, a. What is the estimate of the population mean amount adults spend on a Halloween costume (to 2 decimals)? (3) b. What is the sample standard deviation (to 2 decimals)? c. Provide a \( 95 \% \) confidence interval estimate of the population standard deviation for the amount adults spend ori a Halloween costume (to 2 decimals), use rable 11.1. \[ \$ \quad \bigoplus \leq \sigma \leq 8 \]
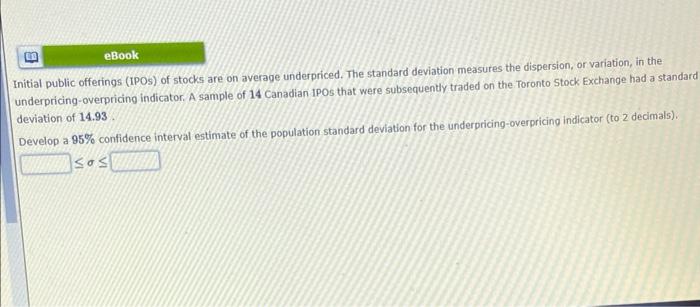
Initial public offerings (IPOS) of stocks are on average underpriced. The standard deviation measures the dispersion, or variation, in the underpricing-overpricing indicator. A sample of 14 Canadian IPOs that were subsequently traded on the Toronto Stock Exchange had a standard deviation of \( 14.93 \) Develop a \( 95 \% \) confidence interval estimate of the population standard deviation for the underpricing-overpricing indicator (to 2 decimals), \[ \leq \sigma \leq \]
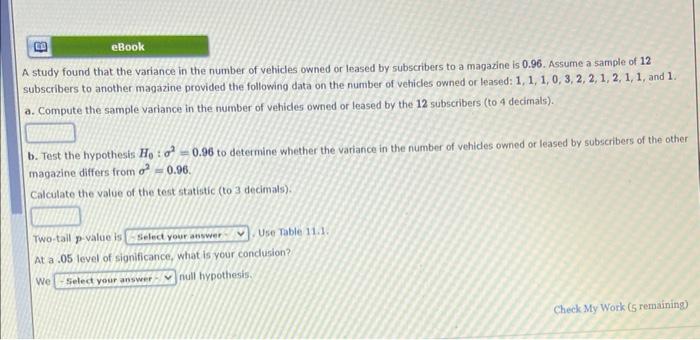
A study found that the variance in the number of vehicles owned or leased by subscribers to a magazine is \( 0.96 \). Assume a sample of 12 subscribers to another magazine provided the following data on the number of vehicles owned or leased: \( 1,1,1,0,3,2,2,1,2,1,1 \), and 1. a. Compute the sample variance in the number of vehides owned or leased by the 12 subscribers (to 4 decimals). b. Test the hypothesis \( H_{0}: \sigma^{2}=0.96 \) to determine whether the variance in the number of vehides owned of leased by subscribers of the other magazine differs from \( \sigma^{2}=0.96 \). Calculate the value of the test statistic (to 3 decimals). Two-tall p-value is Use rable \( 11.1 \). At a .05 level of significance, what is your condusion? We null hypothesis.
Expert Answer
Since there are multiple questions, I solved 1st question as