Home /
Expert Answers /
Statistics and Probability /
and-b-click-here-to-view-page-1-of-the-critical-values-for-the-t-distribution-click-here-to-view-pa729
(Solved): and (b) Click here to view page 1 of the critical values for the t Distribution. Click here to view ...


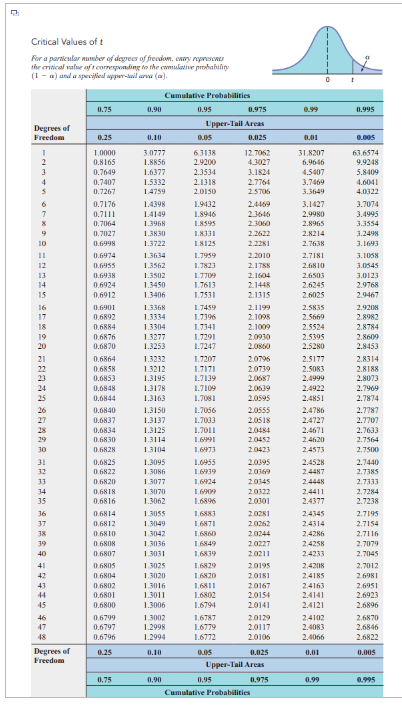

and (b) Click here to view page 1 of the critical values for the Distribution. Click here to view page 2 of the critical values for the Distribution. a. Is there evidence that the population mean amount is different from 8.17 ounces? (Use a 0.10 level of significance.) State the null and alternative hypotheses. (Type integers or decimals.) Identify the critical value(s). The critical value(s) is(are) (Round to four decimal places as needed. Use a comma to separate answers as needed.) Determine the test statistic. The test statistic is (Round to four decimal places as needed.) State the conclusion. . There is evidence to conclude the population mean amount is different from 8.17 ounces.
b. Determine the p-value and interpret its meaning. The p-value is (Round to four decimal places as needed.) Interpret the meaning of the p-value. Choose the correct answer below. A. The p-value is the probability of obtaining a sample mean that is equal to or more extreme than 0.009 ounce away from 8.17 if the null hypothesis is true. B. The p-value is the probability of not rejecting the null hypothesis when it is false. C. The p-value is the probability of obtaining a sample mean that is equal to or more extreme than 0.009 ounce below 8.17 if the null hypothesis is false. D. The p-value is the probability of obtaining a sample mean that is equal to or more extreme than 0.009 ounce above 8.17 if the null hypothesis is false.
Critical Values of t For a parkcular nuwber of dhyres of freciam, cwiy nypersis the mitial nalue af mreservadene to the rwmulatio nrahahifits
Expert Answer
a. To test whether there is evidence that the population mean amount is different from 8.17 ounces, we can set up the following hypotheses: Null Hypothesis Alternative Hypothesis The critical value(s) can be determined using the significance level of 0.10 and the degrees of freedom, which is (sample size - 1) =