Home /
Expert Answers /
Statistics and Probability /
b-the-data-in-table-1-show-the-average-growth-of-7-cherry-trees-since-being-planted-at-the-time-pa288
(Solved): (b) The data in Table 1 show the average growth of 7 cherry trees since being planted. At the time ...
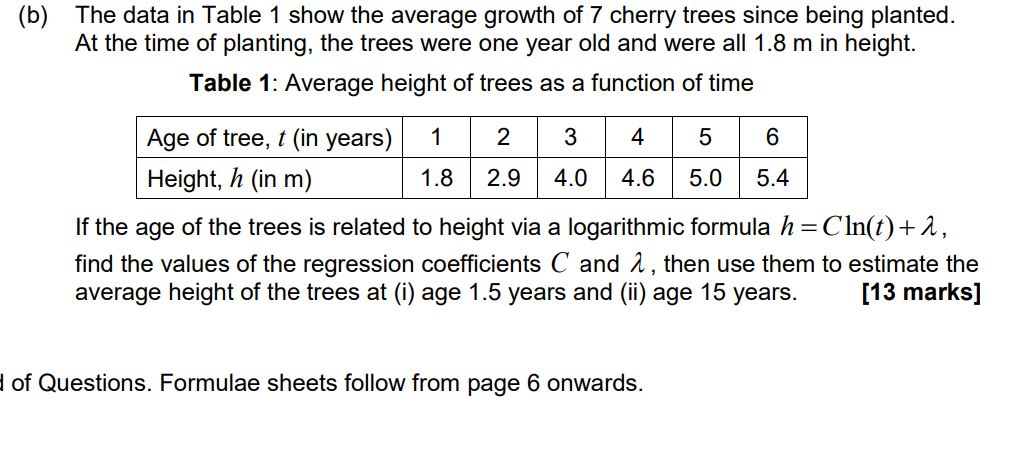
(b) The data in Table 1 show the average growth of 7 cherry trees since being planted. At the time of planting, the trees were one year old and were all in height. Table 1: Average height of trees as a function of time If the age of the trees is related to height via a logarithmic formula , find the values of the regression coefficients and , then use them to estimate the average height of the trees at (i) age 1.5 years and (ii) age 15 years. [13 marks] of Questions. Formulae sheets follow from page 6 onwards.
Expert Answer
To find the values of the regression coefficients C and 2 in the formula h = Cln(t) + 2, we can use ...