Home /
Expert Answers /
Finance /
based-on-the-bloomberg-ddm-screenshots-below-which-company-is-the-most-undervalued-and-which-is-the-pa344
(Solved): Based on the Bloomberg DDM screenshots below, which company is the most undervalued and which is the ...
Based on the Bloomberg DDM screenshots below, which company is the most undervalued and which is the most overvalued on a percentage basis? AT&T is the most undervalued and T-Mobile is the most overvalued. AT&T is the most overvalued and T-Mobile is the most undervalued. Verizon is the most undervalued and AT&T is the most overvalued.
Based on the Bloomberg DDM screenshots below, which company is the most undervalued and which is the most overvalued on a percentage basis? AT\&T is the most undervalued and T-Mobile is the most overvalued. AT\&T is the most overvalued and -Mobile is the most undervalued. Verizon is the most undervalued and AT\&T is the most overvalued.
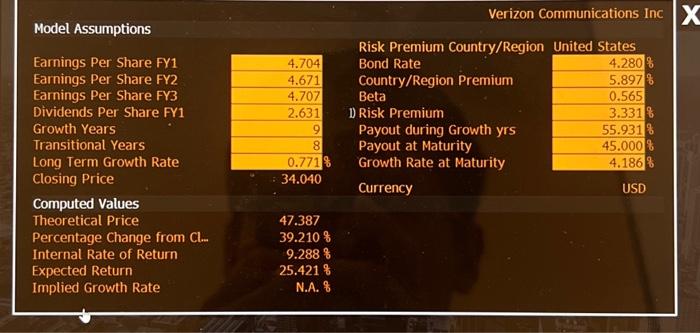
\begin{tabular}{|c|c|c|c|} \hline & & \multicolumn{2}{|c|}{ Verizon Communications Inc } \\ \hline \multicolumn{4}{|l|}{ Model Assumptions } \\ \hline & & Risk Premium Country/Region & United States \\ \hline Earnings Per Share Fy1 & 4.704 & Bond Rate & \\ \hline Earnings Per Share FY2 & 4.671 & Country/Region Premium & \\ \hline Earnings Per Share FY3 & 4.707 & Beta & 0.565 \\ \hline Dividends Per Share FY1 & 2.631 & 1) Risk Premium & 3.3318 \\ \hline Growth Years & 9 & Payout during Growth yrs & \\ \hline Transitional Years & 8 & Payout at Maturity & \\ \hline Long Term Growth Rate & & Growth Rate at Maturity & \\ \hline Closing Price & & Currency & USD \\ \hline \multicolumn{4}{|l|}{ Computed Values } \\ \hline Theoretical Price & 47.387 & & \\ \hline Percentage Change from . & & & \\ \hline Internal Rate of Return & 9.288 항 & : & \\ \hline Expected Return & & & \\ \hline Implied Growth Rate & N.A. & & \\ \hline \end{tabular}
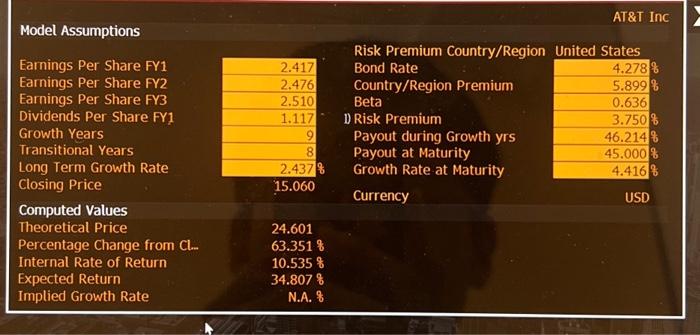
Model Assumptions Earnings Per Share FY1 Earnings Per Share FY2 Earnings Per Share FY3 Dividends Per Share FY1 Growth Years Transitional Years Long Term Growth Rate Closing Price Computed Values Theoretical Price Percentage Change from . Internal Rate of Return Expected Return Implied Growth Rate AT\&T Inc Risk Premium Country/Region United States Bond Rate Country/Region Premium Beta D Risk Premium Payout during Growth yrs Payout at Maturity Growth Rate at Maturity \begin{tabular}{|r|} \hline 4.278 \\ \hline 5.899 \\ \hline 0.636 \\ \hline 3.750 \\ \hline 46.214 \\ \hline 45.000 \\ \hline 4.416 \\ \hline USD \\ \hline \end{tabular} Currency 24.601 N.A. के
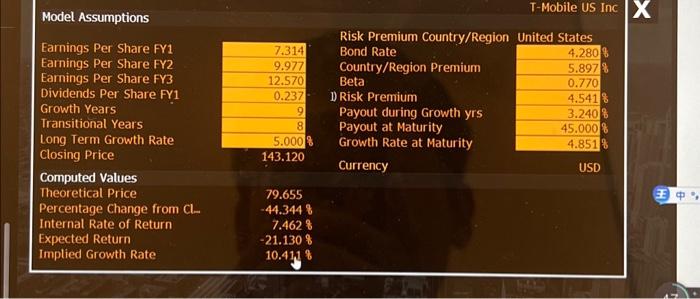
\begin{tabular}{|c|c|c|c|} \hline \multicolumn{4}{|l|}{ Model Assumptions } \\ \hline & & Risk Premium Country/Region & United States \\ \hline Earnings Per Share FY1 & 7.314 & Bond Rate & \\ \hline Earnings Per Share FY2 & 9.977 & Country/Region Premium & 5.8978 \\ \hline Earnings Per Share FY3 & 12.570 & Beta & 0.770 \\ \hline Dividends Per Share FY1 & 0.237 & 1) Risk Premium & 4.541 \% \\ \hline Growth Years & 9 & Payout during Growth yrs & \\ \hline Transitional Years & 8 & Payout at Maturity & 45.0008 \\ \hline Long Term Growth Rate & & Growth Rate at Maturity & 4.8518 \\ \hline Closing Price & 143.120 & Currency & USD \\ \hline \multicolumn{4}{|l|}{ Computed Values } \\ \hline Theoretical Price & 79.655 & & \\ \hline Percentage Change from & -44.3448 & & \\ \hline Internal Rate of Return & 7.4628 & & \\ \hline Expected Return & & & \\ \hline Implied Growth Rate & & & \\ \hline \end{tabular}