Home /
Expert Answers /
Biology /
biophysical-experiments-were-carried-out-on-a-monoclonal-antibody-left-and-on-the-protein-cytochro-pa964
(Solved): Biophysical experiments were carried out on a monoclonal antibody (left) and on the protein cytochro ...
Biophysical experiments were carried out on a monoclonal antibody (left) and on the protein cytochrome c (right) to assess their global stability. Pay attention only to the black squares (the raw data) and ignore the lines or other squares which are attempts at fitting to various models of unfolding.
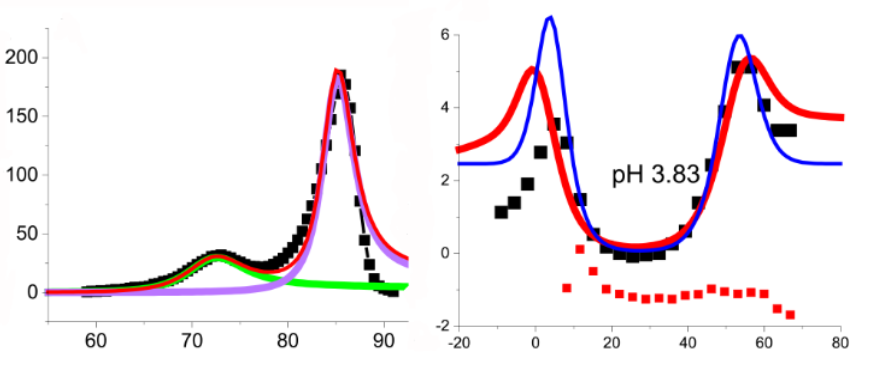
What kind of experiments are these? What do the x and y axes correspond to?
What parameters can be extracted from these plots either visually or by fitting?
What can you say about the unfolding mechanism of the monoclonal antibody?
What can you say about the unfolding of cytochrome c?