Home /
Expert Answers /
Civil Engineering /
c-the-mass-curve-shown-in-the-figure-below-shown-the-cumulative-inflow-of-a-reservoir-illustrate-yo-pa123
(Solved): C. The mass curve shown in the figure below shown the cumulative inflow of a reservoir Illustrate yo ...
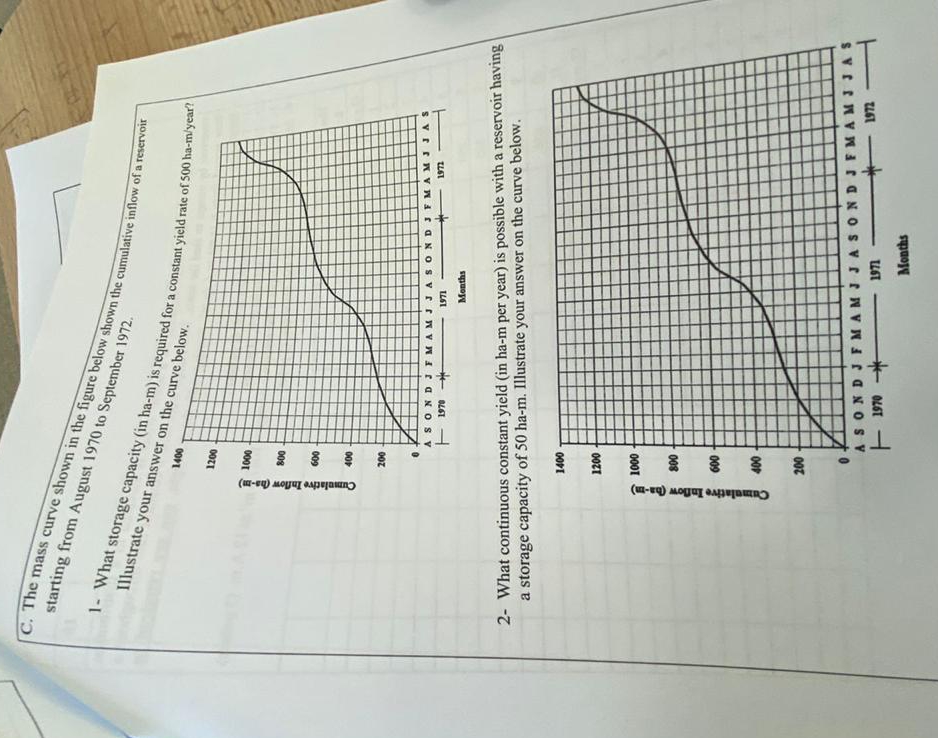
C. The mass curve shown in the figure below shown the cumulative inflow of a reservoir Illustrate your capacity (in ha-m) is required for a constant yield rate of 500 ha-m/year? 2- What continuous constant yield (in ha-m per year) is possible with a reservoir having a storage capacity of 50 ha-m. Illustrate your answer on the curve below.