(Solved): Class Parameters vs. Personal Sample Data The results from the data collection from all last year' ...
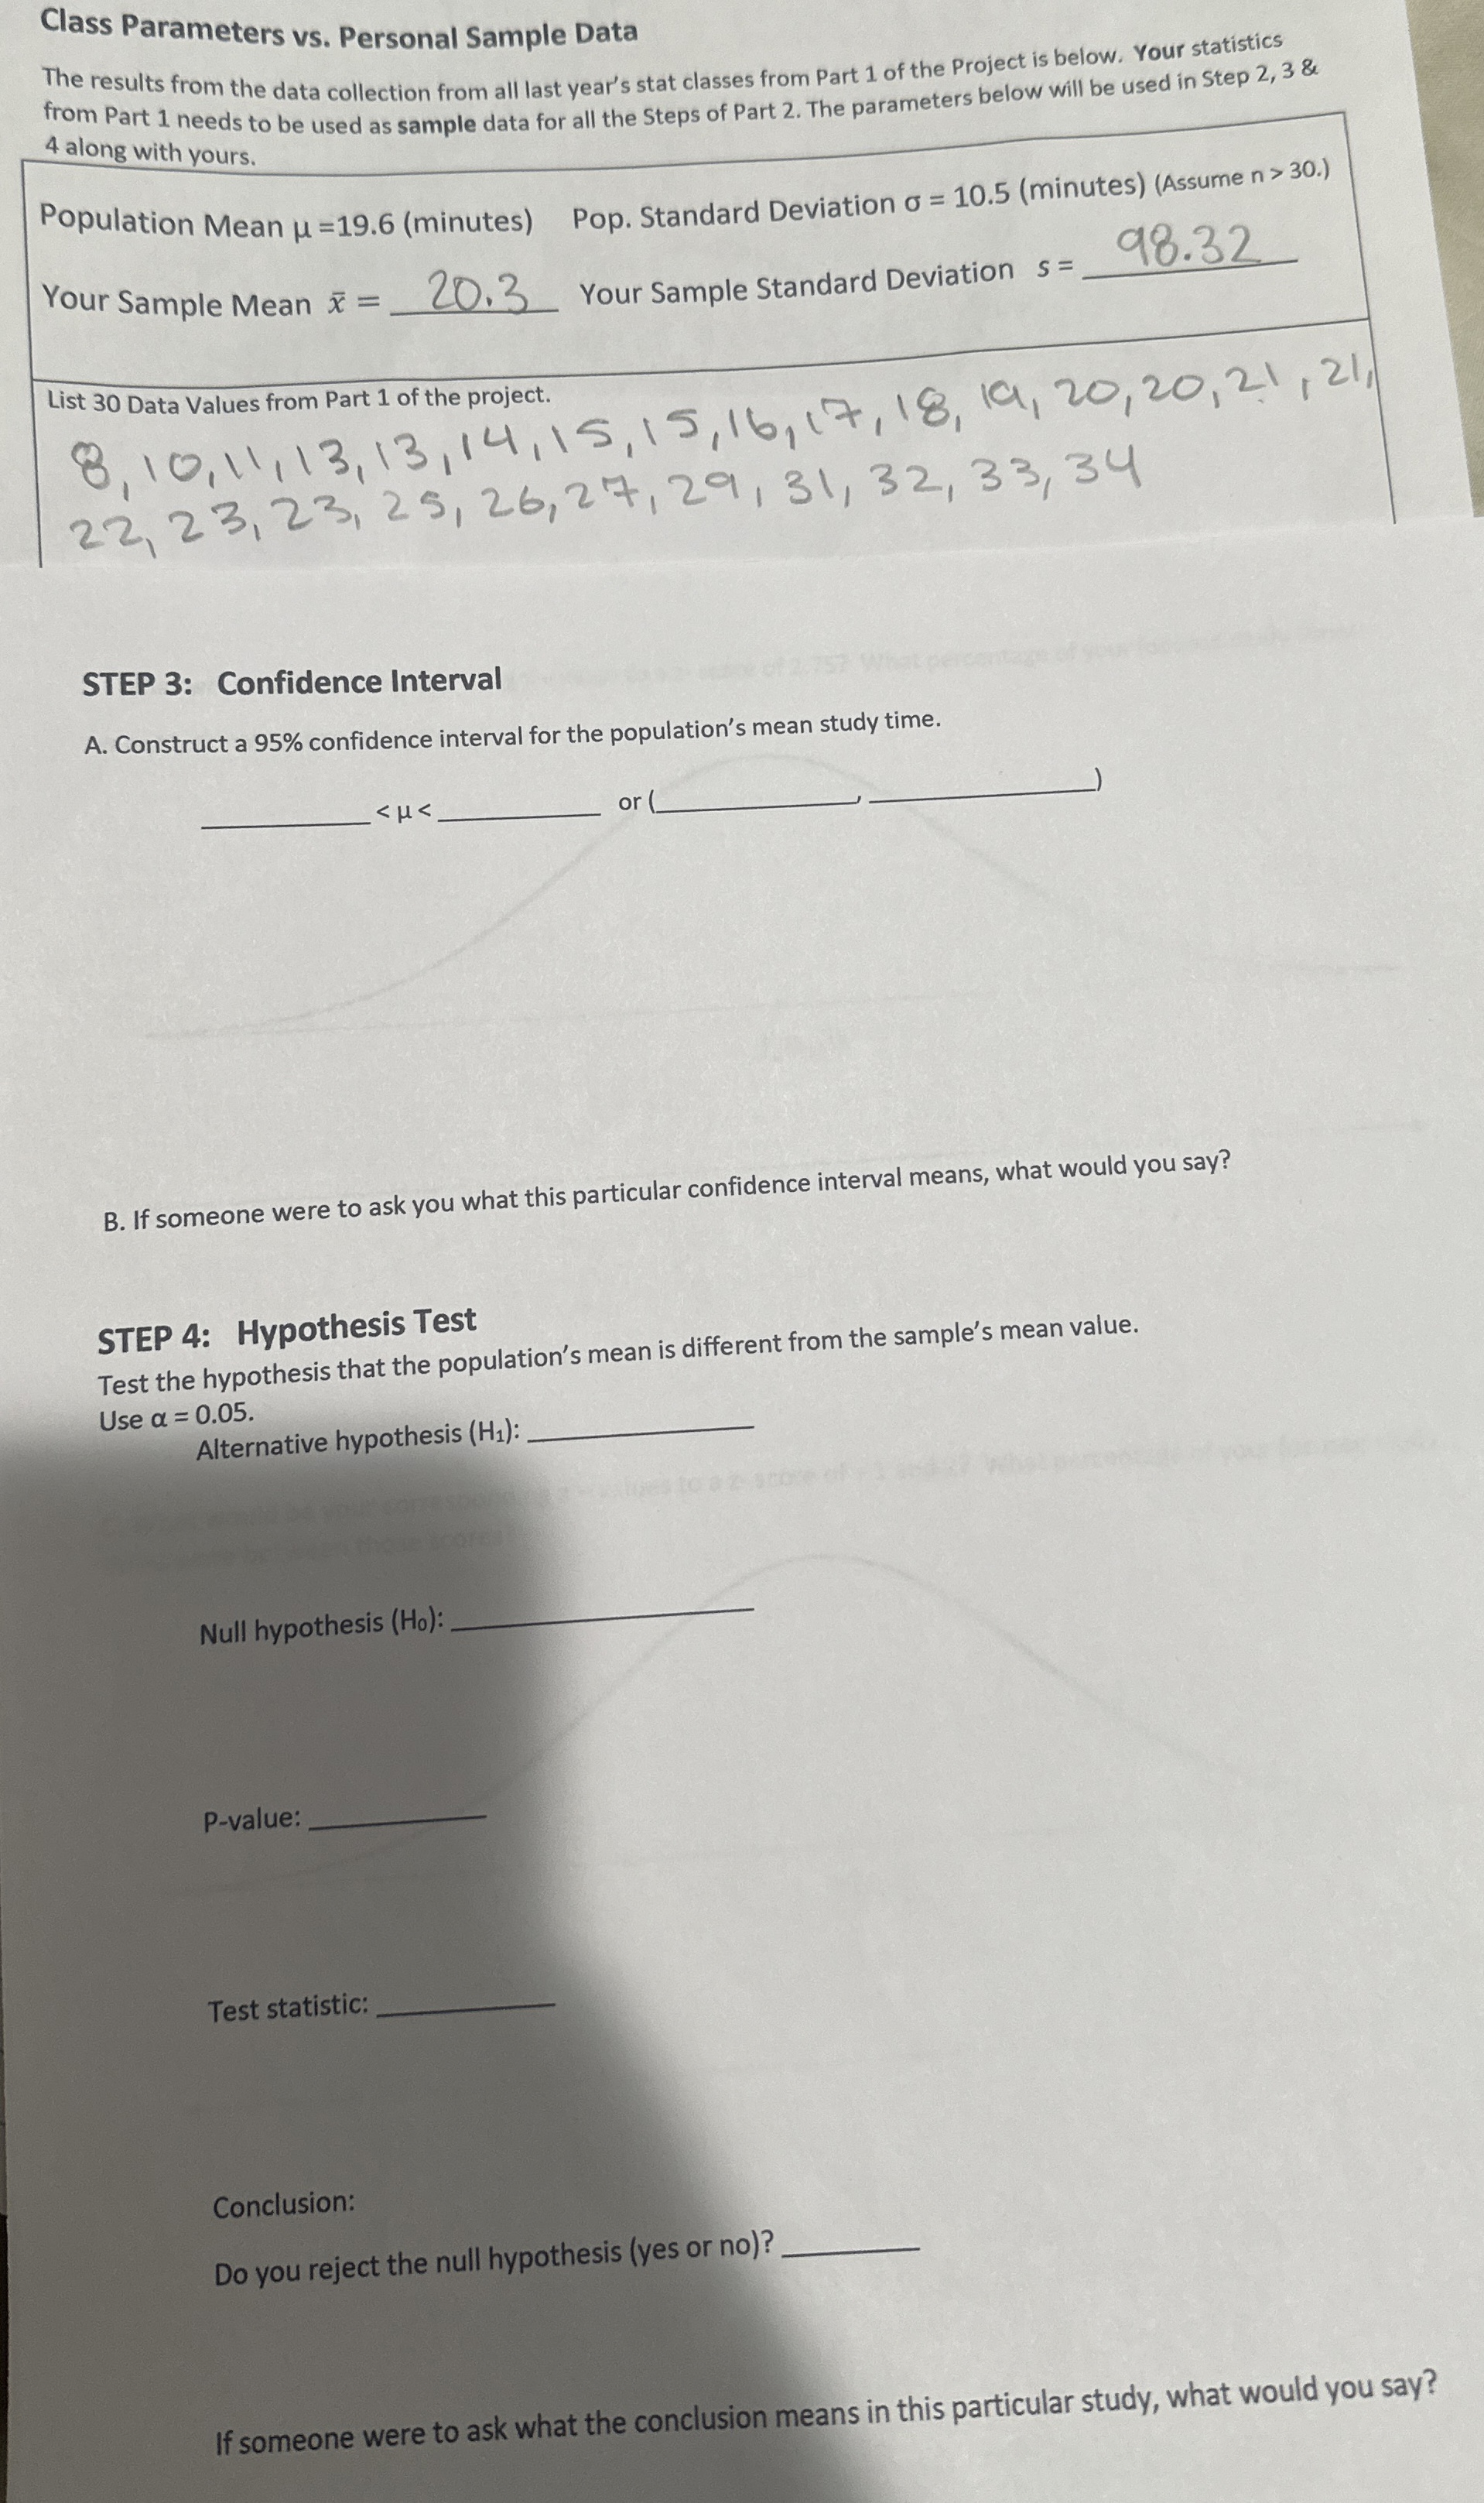
Class Parameters vs. Personal Sample Data The results from the data collection from all last year's stat classes from Part 1 of the Project is below. Your statistics from Part 1 needs to be used as sample data for all the Steps of Part 2. The parameters below will be used in Step 2,3 & 4 along with yours. Population Mean
\mu =19.6(minutes) Pop. Standard Deviation
\sigma =10.5(minutes) (Assume
n>30.) Your Sample Mean
\bar{x} =20.3 Your Sample Standard Deviation
s=
q,98.32 List 30 Data Values from Part 1 of the project.
8,10,11,13,13,14,15,15,16,17,18,19,20,20,21,21
22,23,23,25,26,27,29,31,32,33,34
STEP 3: Confidence Interval A. Construct a
95%confidence interval for the population's mean study time.
q,
<\mu <
q,or (
q,, _) B. If someone were to ask you what this particular confidence interval means, what would you say? STEP 4: Hypothesis Test Test the hypothesis that the population's mean is different from the sample's mean value. Use
\alpha =0.05. Alternative hypothesis
(H_(1)):
q,Null hypothesis
(H_(0))P-value
◻Test statistic:
◻Conclusion: Do you reject the null hypothesis (yes or no)?
◻If someone were to ask what the conclusion means in this particular study, what would you say?