(Solved): Consider the demand for Fresh Detergent in a future sales period when Enterprise Industries' price f ...
Consider the demand for Fresh Detergent in a future sales period when Enterprise Industries' price for Fresh will be
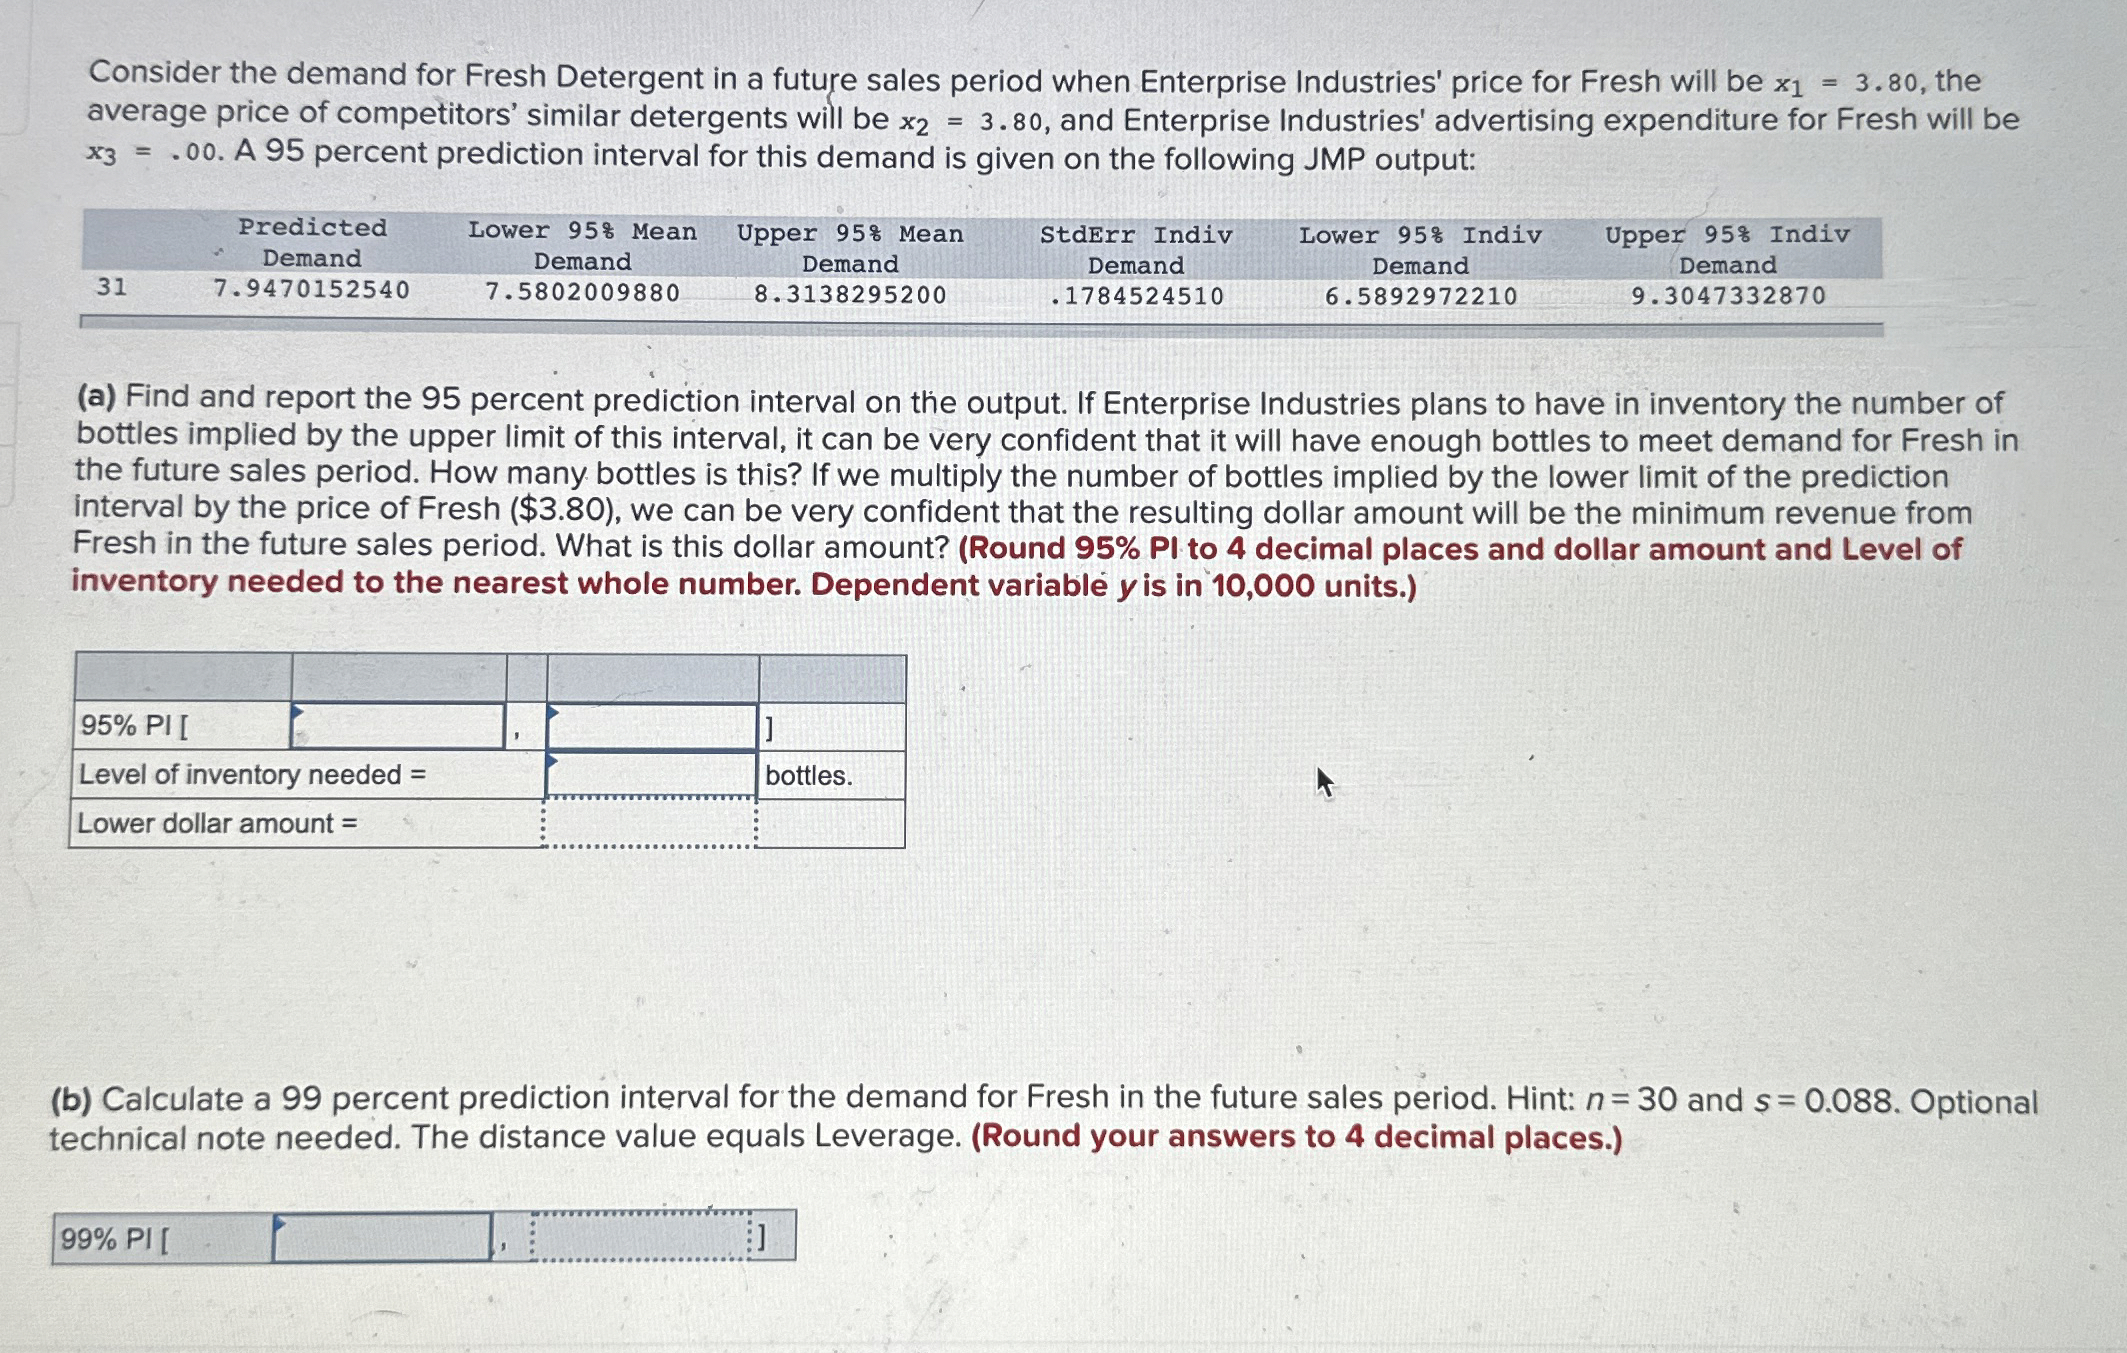
x_(1)=3.80, the average price of competitors' similar detergents will be
x_(2)=3.80, and Enterprise Industries' advertising expenditure for Fresh will be
x_(3)=.00. A 95 percent prediction interval for this demand is given on the following JMP output: \table[[,Predicted,Lower 95% Mean,Upper 95% Mean,StdErr Indiv,Lower 95% Indiv,],[Demand,Demand,Demand,Demand,Demand,Demand,],[31,7.9470152540,7.5802009880,8.3138295200,.1784524510,6.5892972210,9.3047332870]] (a) Find and report the 95 percent prediction interval on the output. If Enterprise Industries plans to have in inventory the number of bottles implied by the upper limit of this interval, it can be very confident that it will have enough bottles to meet demand for Fresh in the future sales period. How many bottles is this? If we multiply the number of bottles implied by the lower limit of the prediction interval by the price of Fresh (
$3.80), we can be very confident that the resulting dollar amount will be the minimum revenue from Fresh in the future sales period. What is this dollar amount? (Round
95(%)/(P)I to 4 decimal places and dollar amount and Level of inventory needed to the nearest whole number. Dependent variable
yis in 10,000 units.) \table[[,,,],[
95%PI [,,,,]],[Level of inventory needed
=,,bottles.,],[Lower dollar amount
=,
vdots,,]] (b) Calculate a 99 percent prediction interval for the demand for Fresh in the future sales period. Hint:
n=30and
s=0.088. Optional technical note needed. The distance value equals Leverage. (Round your answers to 4 decimal places.)
99%PI [
,,