Home /
Expert Answers /
Computer Science /
consider-the-following-system-of-differential-equations-dx-tx-dt-1-x-y-x-y-2xy-1-pa251
(Solved): Consider the following system of differential equations: dx tx = dt 1 + x + y x + y - 2xy 1+ ...
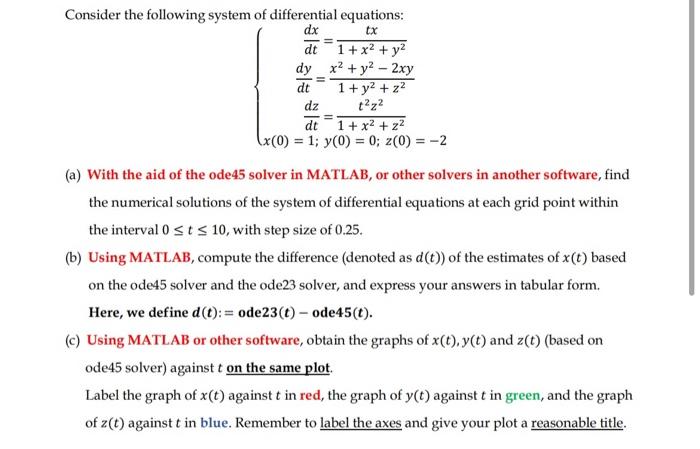
Consider the following system of differential equations: dx tx = dt 1 + x² + y² x² + y² - 2xy 1+ y² + z² t²z² dy dt - dz dt 1 + x² + z² x (0) = 1; y(0) = 0; z(0) = -2 (a) With the aid of the ode45 solver in MATLAB, or other solvers in another software, find the numerical solutions of the system of differential equations at each grid point within the interval 0 ≤ t ≤ 10, with step size of 0.25. (b) Using MATLAB, compute the difference (denoted as d (t)) of the estimates of x (t) based on the ode45 solver and the ode23 solver, and express your answers in tabular form. Here, we define d (t): = ode23 (t)- ode45 (t). (c) Using MATLAB or other software, obtain the graphs of x(t), y(t) and z(t) (based on ode45 solver) against t on the same plot. Label the graph of x(t) against t in red, the graph of y(t) against t in green, and the graph of z(t) against t in blue. Remember to label the axes and give your plot a reasonable title.
Consider the following system of differential equations: (a) With the aid of the ode45 solver in MATLAB, or other solvers in another software, find the numerical solutions of the system of differential equations at each grid point within the interval , with step size of 0.25 . (b) Using MATLAB, compute the difference (denoted as ) of the estimates of based on the ode 45 solver and the ode 23 solver, and express your answers in tabular form. Here, we define . (c) Using MATLAB or other software, obtain the graphs of and (based on ode 45 solver) against on the same plot. Label the graph of against in red, the graph of against in green, and the graph of against in blue. Remember to label the axes and give your plot a reasonable title.