Home /
Expert Answers /
Mechanical Engineering /
consider-the-two-processes-shown-in-table-1-the-sample-size-n-5-specifications-are-at-10010-pa139
(Solved): Consider the two processes shown in Table 1 (the sample size n= 5). Specifications are at 10010. ...
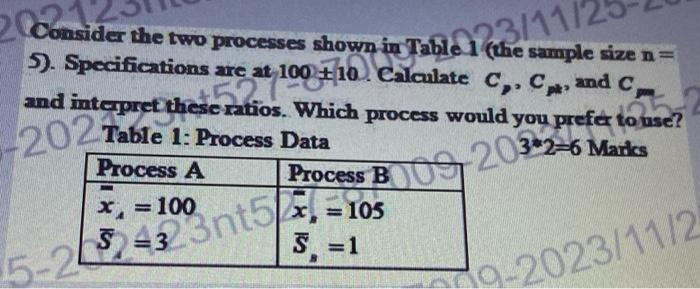
Consider the two processes shown in Table 1 (the sample size 5). Specifications are at . Calculate and and interpret theseratios. Which process would you prefer to thse? Table 1: Process Data