Home /
Expert Answers /
Statistics and Probability /
draw-a-histogram-of-the-following-data-label-the-tails-left-and-right-is-the-distribution-posit-pa965
(Solved): Draw a histogram of the following data. Label the tails (left and right). Is the distribution posit ...
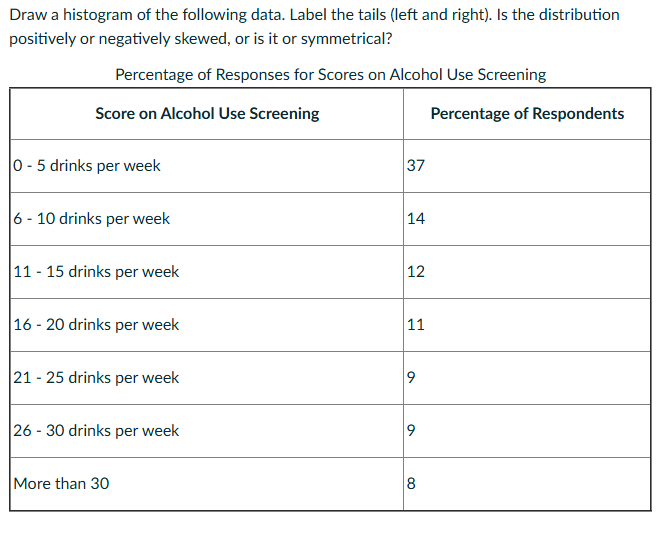
Draw a histogram of the following data. Label the tails (left and right). Is the distribution positively or negatively skewed, or is it or symmetrical? Percentage of Responses for Scores on Alcohol Use Screening
\table[[Score on Alcohol Use Screening,Percentage of Respondents],[0 - 5 drinks per week,37],[6 - 10 drinks per week,14],[11 - 15 drinks per week,12],[16 - 20 drinks per week,11],[21 - 25 drinks per week,9],[26 - 30 drinks per week,9],[More than 30,8]]