Home /
Expert Answers /
Statistics and Probability /
each-year-the-national-highway-traffic-safety-administration-nhtsa-together-with-the-national-cen-pa419
(Solved): Each year, the National Highway Traffic Safety Administration (NHTSA) together with the National Cen ...
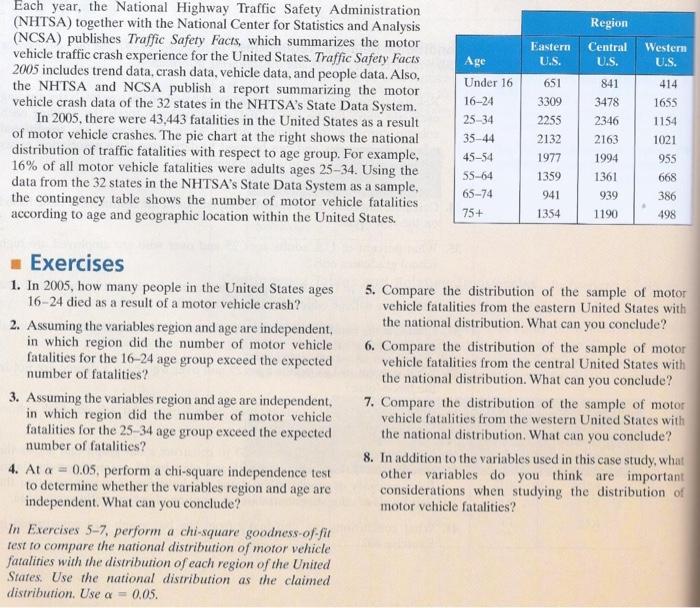
Each year, the National Highway Traffic Safety Administration (NHTSA) together with the National Center for Statistics and Analysis (NCSA) publishes Traffic Safety Facts, which summarizes the motor vehicle traffic crash experience for the United States. Traffic Safety Facts 2005 includes trend data, crash data, vehicle data, and people data. Also, the NHTSA and NCSA publish a report summarizing the motor vehicle crash data of the 32 states in the NHTSA's State Data System. In 2005, there were 43,443 fatalities in the United States as a result of motor vehicle crashes. The pie chart at the right shows the national distribution of traffic fatalities with respect to age group. For example, 16% of all motor vehicle fatalities were adults ages 25-34. Using the data from the 32 states in the NHTSA's State Data System as a sample, the contingency table shows the number of motor vehicle fatalities according to age and geographic location within the United States. ■ Exercises 1. In 2005, how many people in the United States ages 16-24 died as a result of a motor vehicle crash? 2. Assuming the variables region and age are independent, in which region did the number of motor vehicle fatalities for the 16-24 age group exceed the expected number of fatalities? 3. Assuming the variables region and age are independent, in which region did the number of motor vehicle fatalities for the 25-34 age group exceed the expected number of fatalities? 4. At a = 0.05, perform a chi-square independence test to determine whether the variables region and age are independent. What can you conclude? In Exercises 5-7, perform a chi-square goodness-of-fit test to compare the national distribution of motor vehicle fatalities with the distribution of each region of the United States. Use the national distribution as the claimed distribution. Use a = 0.05. Age Under 16 16-24 25-34 35-44 45-54 55-64 65-74 75+ Eastern U.S. 651 3309 2255 2132 1977 1359 941 1354 Region Central U.S. 841 3478 2346 2163 1994 1361 939 1190 Western U.S. 414 1655 1154 1021 955 668 386 498 5. Compare the distribution of the sample of motor vehicle fatalities from the eastern United States with the national distribution. What can you conclude? 6. Compare the distribution of the sample of motor vehicle fatalities from the central United States with the national distribution. What can you conclude? 7. Compare the distribution of the sample of motor vehicle fatalities from the western United States with the national distribution. What can you conclude? 8. In addition to the variables used in this case study, what other variables do you think are important considerations when studying the distribution of motor vehicle fatalities?

Each year, the National Highway Traffic Safety Administration (NHTSA) together with the National Center for Statistics and Analysis (NCSA) publishes Traffic Safety Facts, which summarizes the motor vehicle traffic crash experience for the United States. Traffic Safety Facts 2005 includes trend data, crash data, vehicle data, and people data. Also, the NHTSA and NCSA publish a report summarizing the motor vehicle crash data of the 32 states in the NHTSA's State Data System. In 2005, there were 43,443 fatalities in the United States as a result of motor vehicle crashes. The pie chart at the right shows the national distribution of traffic fatalities with respect to age group. For example, of all motor vehicle fatalities were adults ages . Using the data from the 32 states in the NHTSA's State Data System as a sample, the contingency table shows the number of motor vehicle fatalities according to age and geographic location within the United States. Exercises 1. In 2005 , how many people in the United States ages died as a result of a motor vehicle crash? 2. Assuming the variables region and age are independent, in which region did the number of motor vehicle fatalities for the 16-24 age group exceed the expected number of fatalities? 3. Assuming the variables region and age are independent, in which region did the number of motor vehicle fatalities for the 25-34 age group exceed the expected number of fatalities? 4. At , perform a chi-square independence test to determine whether the variables region and age are independent. What can you conclude? In Exercises 5-7, perform a chi-square goodness-of-fit test to compare the national distribution of motor vehicle fatalities with the distribution of each region of the United States. Use the national distribution as the claimed distribution. Use 5. Compare the distribution of the sample of motor vehicle fatalities from the eastern United States with the national distribution. What can you conclude? 6. Compare the distribution of the sample of motor vehicle fatalities from the central United States with the national distribution. What can you conclude? 7. Compare the distribution of the sample of motor vehicle fatalities from the western United States with the national distribution. What can you conclude? 8. In addition to the variables used in this case study, what other variables do you think are important considerations when studying the distribution of motor vehicle fatalities?
Each year, the National Highway Traffic Safety Administration (NHTSA) together with the National Center for Statistics and Analysis (NCSA) publishes Traffic Safety Facts, which summarizes the motor vehicle traffic crash experience for the United States. Traffic Safety Facts 2005 includes trend data, crash data, vehicle data, and people data. Also, the NHTSA and NCSA publish a report summarizing the motor vehicle crash data of the 32 states in the NHTSA's State Data System. In 2005, there were 43,443 fatalities in the United States as a result of motor vehicle crashes. The pie chart at the right shows the national distribution of traffic fatalities with respect to age group. For example, of all motor vehicle fatalities were adults ages . Using the data from the 32 states in the NHTSA's State Data System as a sample, the contingency table shows the number of motor vehicle fatalities according to age and geographic location within the United States. Exercises 1. In 2005 , how many people in the United States ages died as a result of a motor vehicle crash? 2. Assuming the variables region and age are independent, in which region did the number of motor vehicle fatalities for the 16-24 age group exceed the expected number of fatalities? 3. Assuming the variables region and age are independent, in which region did the number of motor vehicle fatalities for the 25-34 age group exceed the expected number of fatalities? 4. At , perform a chi-square independence test to determine whether the variables region and age are independent. What can you conclude? In Exercises 5-7, perform a chi-square goodness-of-fit test to compare the national distribution of motor vehicle fatalities with the distribution of each region of the United States. Use the national distribution as the claimed distribution. Use 5. Compare the distribution of the sample of motor vehicle fatalities from the eastern United States with the national distribution. What can you conclude? 6. Compare the distribution of the sample of motor vehicle fatalities from the central United States with the national distribution. What can you conclude? 7. Compare the distribution of the sample of motor vehicle fatalities from the western United States with the national distribution. What can you conclude? 8. In addition to the variables used in this case study, what other variables do you think are important considerations when studying the distribution of motor vehicle fatalities?
Expert Answer
To answer the exercises, let's analyze the given information step by step:In 2005, how many people in the United States ages 16-24 died as a result of a motor vehicle crash?According to the pie chart, the percentage of motor vehicle fatalities for the age group 16-24 is 18%. Since the total number of fatalities in the United States in 2005 was 43,443, we can calculate the number of people in the age group 16-24 who died as a result of a motor vehicle crash as follows:Number of fatalities = Total fatalities × Percentage for age group Number of fatalities Number of fatalities (approximately)