Home /
Expert Answers /
Chemistry /
experiment-1-in-excel-create-a-graph-of-pressure-in-atm-y-axis-versus-1-volume-of-propane-in-1-pa211
(Solved): Experiment 1: In Excel, create a graph of pressure in atm (y-axis) versus 1/volume of propane in 1 ...
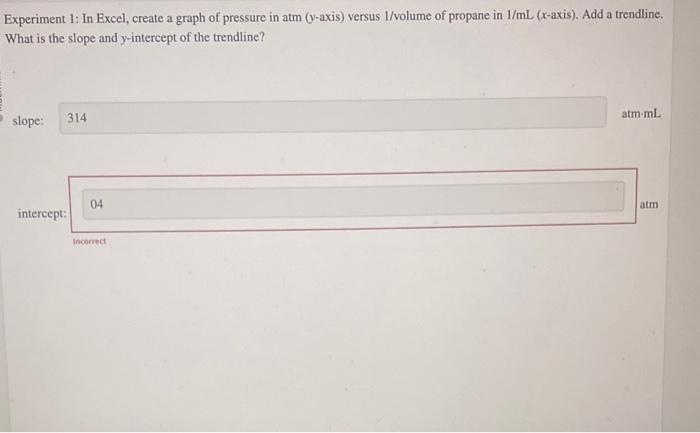
Experiment 1: In Excel, create a graph of pressure in atm (y-axis) versus 1/volume of propane in 1/mL ( \( x \)-axis). Add a trendline. What is the slope and \( y \)-intercept of the trendline? slope: atm.mL interec
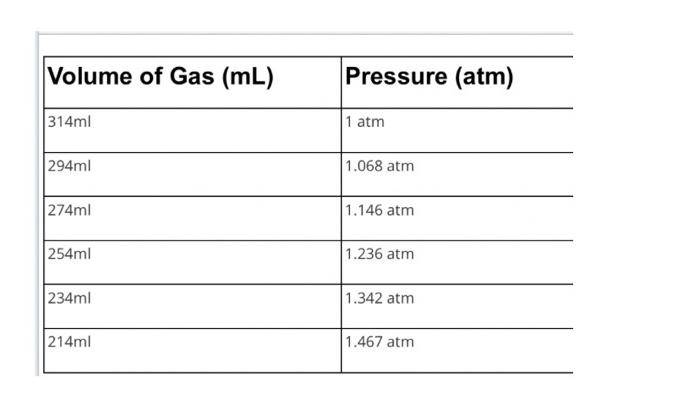
\begin{tabular}{|l|l} \hline Volume of Gas (mL) & Pressure \( \mathbf{( a t m )} \) \\ \hline \( 314 \mathrm{ml} \) & \( 1 \mathrm{~atm} \) \\ \hline \( 294 \mathrm{ml} \) & \( 1.068 \mathrm{~atm} \) \\ \hline \( 274 \mathrm{ml} \) & \( 1.146 \mathrm{~atm} \) \\ \hline \( 254 \mathrm{ml} \) & \( 1.236 \mathrm{~atm} \) \\ \hline \( 234 \mathrm{ml} \) & \( 1.342 \mathrm{~atm} \) \\ \hline \( 214 \mathrm{ml} \) & \( 1.467 \mathrm{~atm} \) \\ \hline \end{tabular}
Expert Answer
Here I have taken pressure as the y axis and made reciprocal of the vo