Home /
Expert Answers /
Economics /
figure-1-below-shows-a-country-39-s-before-and-after-trade-cquilibria-suppose-t-pa280
(Solved): Figure 1 below shows a country's before and after trade cquilibria. Suppose t ...
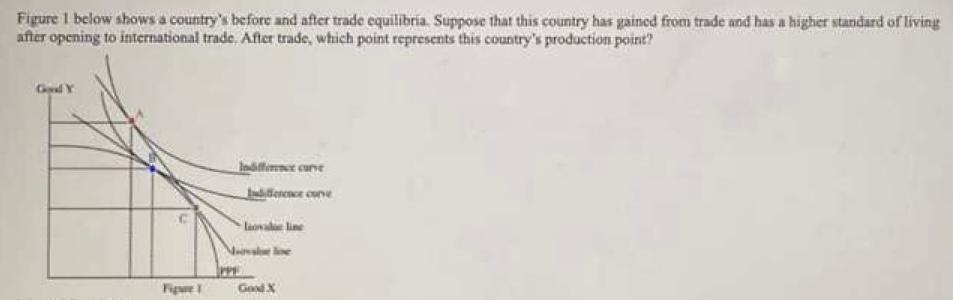
Figure 1 below shows a country's before and after trade cquilibria. Suppose that this country has gaincd from trade and has a higher standard of living after opening to itternational trade, After trade, which point represents this country's production point?
Expert Answer
PPF is a graph that illustrates all the corresponding output comb