Home /
Expert Answers /
Electrical Engineering /
figure-1-shows-a-single-line-diagram-of-a-three-bus-power-system-load-flow-bus-input-data-is-give-pa265
(Solved): Figure 1 shows a single-line diagram of a three-bus power system. Load flow bus input data is give ...
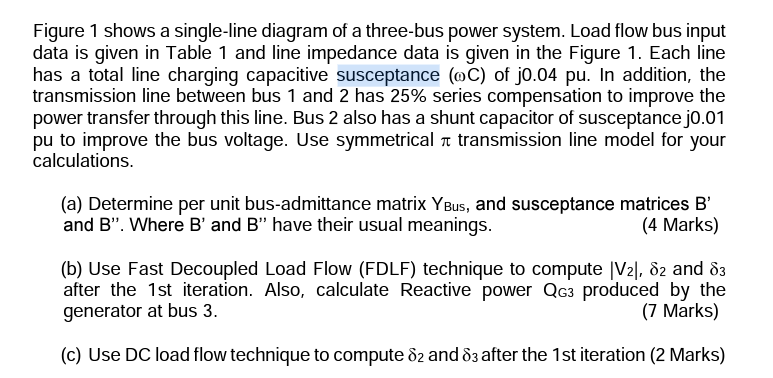
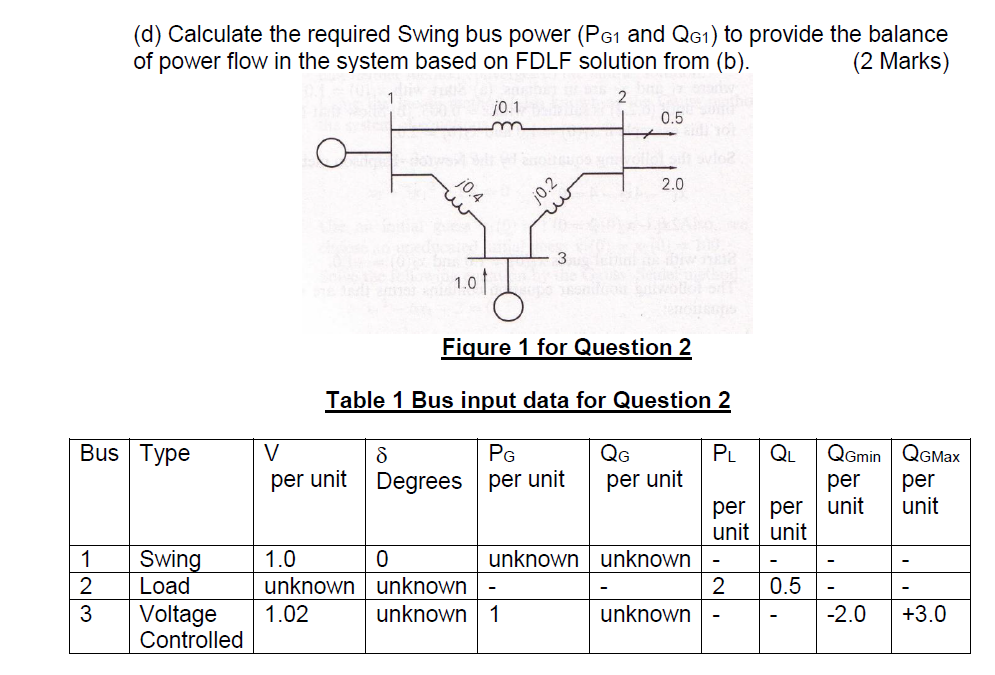
Figure 1 shows a single-line diagram of a three-bus power system. Load flow bus input data is given in Table 1 and line impedance data is given in the Figure 1. Each line has a total line charging capacitive susceptance (oC) of j0.04 pu. In addition, the transmission line between bus 1 and 2 has 25% series compensation to improve the power transfer through this line. Bus 2 also has a shunt capacitor of susceptance j0.01 pu to improve the bus voltage. Use symmetrical transmission line model for your calculations. (a) Determine per unit bus-admittance matrix YBus, and susceptance matrices B' and B". Where B' and B" have their usual meanings. (4 Marks) (b) Use Fast Decoupled Load Flow (FDLF) technique to compute |V?|, 82 and 83 after the 1st iteration. Also, calculate Reactive power QG3 produced by the generator at bus 3. (7 Marks) (c) Use DC load flow technique to compute 82 and 83 after the 1st iteration (2 Marks)
123 (d) Calculate the required Swing bus power (PG? and QG?) to provide the balance of power flow in the system based on FDLF solution from (b). (2 Marks) 2 j0.1 0.5 2.0 0.4 w 3 Tell me 1.0 Figure 1 for Question 2 Table 1 Bus input data for Question 2 PG QG Bus Type V 8 per unit Degrees per unit per unit 0 unknown unknown 1.0 unknown unknown unknown 1 unknown Swing Load Voltage 1.02 Controlled PL Q? QGmin per per per unit unit unit 0.5 -2.0 ??? 2 QGMax per unit - +3.0