Home /
Expert Answers /
Physics /
figure-below-shows-the-displacement-versus-time-graph-for-an-oscillation-system-undergoing-three-d-pa590
(Solved): Figure below shows the displacement versus time graph for an oscillation system undergoing three d ...
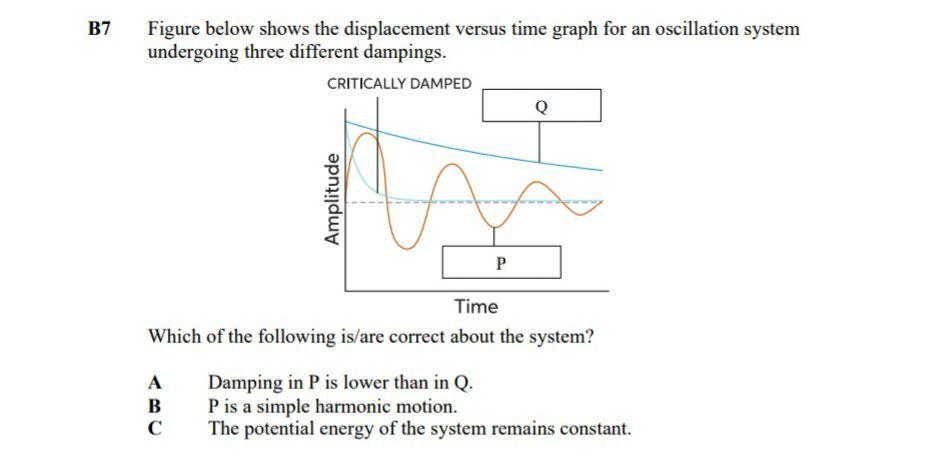
Figure below shows the displacement versus time graph for an oscillation system undergoing three different dampings. Which of the following is/are correct about the system? A Damping in \( \mathrm{P} \) is lower than in \( \mathrm{Q} \). B \( \quad \) P is a simple harmonic motion. C The potential energy of the system remains constant.
Expert Answer
We will check all options one by one that are given to us related to damping oscillations Option A As the damping shifts lower, the sinusoidal graph b