(Solved): Fill in both the Position vs time graph and the acceleration vs time graph Using the velocity ti ...
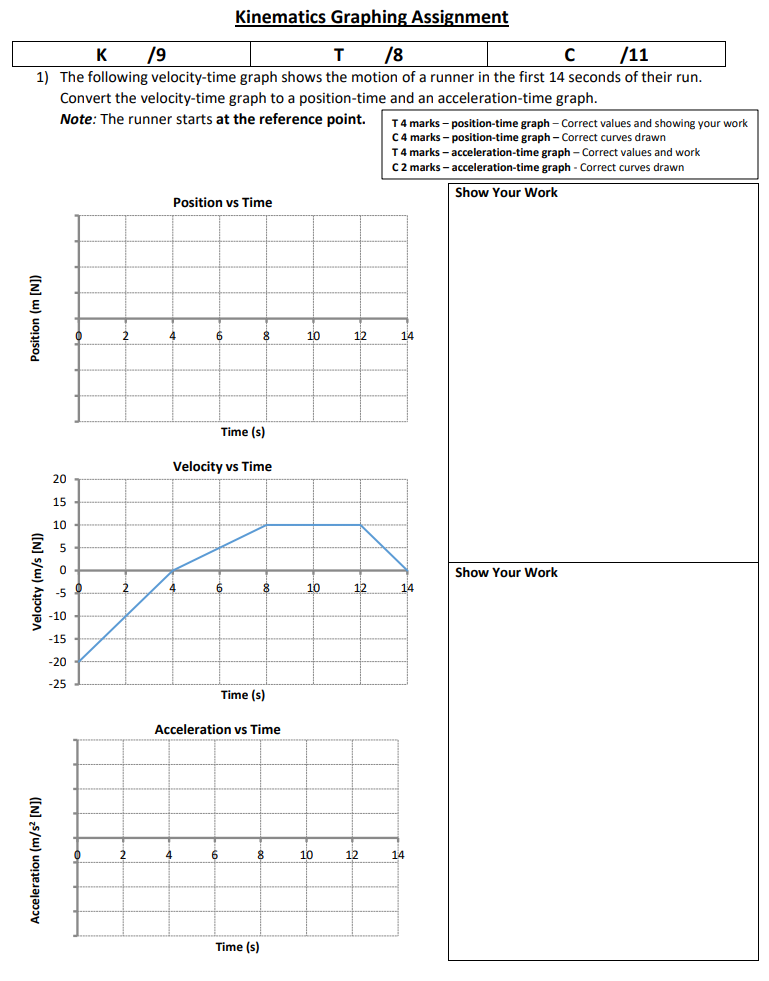
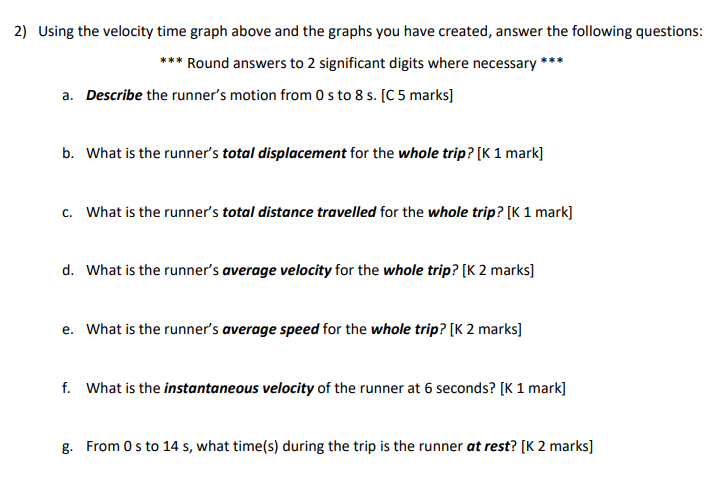
Fill in both the Position vs time graph and the acceleration vs time graph Using the velocity time graph above and the graphs you have created, answer the following questions: *** Round answers to 2 significant digits where necessary *** a. Describe the runner's motion from
0sto
8s. [C 5 marks] b. What is the runner's total displacement for the whole trip? [K 1 mark] c. What is the runner's total distance travelled for the whole trip? [K 1 mark] d. What is the runner's average velocity for the whole trip? [K 2 marks] e. What is the runner's average speed for the whole trip? [K 2 marks] f. What is the instantaneous velocity of the runner at 6 seconds? [K 1 mark] g. From
0sto
14s, what time(s) during the trip is the runner at rest? [K 2 marks]The following velocity-time graph shows the motion of a runner in the first 14 seconds of their run. Convert the velocity-time graph to a position-time and an acceleration-time graph. Note: The runner starts at the reference point. T 4 marks - position-time graph - Correct values and showing your work C 4 marks - position-time graph - Correct curves drawn T 4 marks - acceleration-time graph - Correct values and work C 2 marks - acceleration-time graph - Correct curves drawn Show Your Work Show Your Work