(Solved): Find the (a) mean, (b) median, (c) mode, and (d) midrarge for the given sample data. An experiment w ...
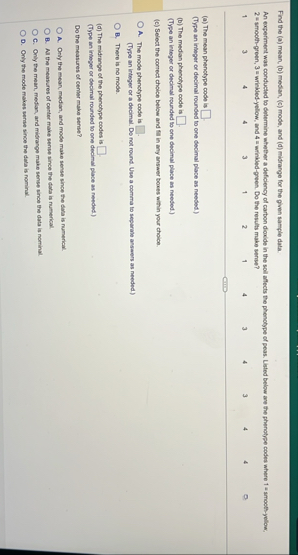
Find the (a) mean, (b) median, (c) mode, and (d) midrarge for the given sample data. An experiment was conducted to determine whether a deficiency of carbon dioxide in the soll affects the phenotype of peas. Listed below ane the phenotype codes where 1 - smooth-yellow. 2 = smooth-green, 3 = wrinkled-yellow, and 4 = wrinkled-green. Do the results make sense? 1 3 4 4 3 1 2 1 4 3 4 3 4 4 (a) The mean phenotype code is
◻(Type an integer or decimal rounded to one decimal place as needed.) (b) The median phenotype code is
◻(Type an integer or decimal rounded to one decimal place as needed.) (c) Select the correct choice below and fill in any answer boxes within your choice.
◻A. The mode phenotype code is
◻(Type an integer or a decimal. Do not round. Use a comma to separate answers as needed.)
◻B. There is no mode. (d) The midrange of the phenotype codes is
◻(Type an integer or decimal rounded to one decimal place as needed.) Do the measures of center make sense?
◻A. Only the mean, median, and mode make sense since the data is numerical.
◻B. All the measures of center make sense aince the data is numerical.
◻C. Only the mean, median, and midrange make sense since the data is nominal.
◻D. Only the mode makes sense since the data is nominal.