(Solved): - First, questions must be solved analytically. - Then PSIM simulations can be used to ve ...
- First, questions must be solved analytically.
- Then PSIM simulations can be used to verify your results.
You must turn in a report including solutions to every part, appropriately commented and a final section with conclusions of what you may consider significant findings.
Problem: Passive rectifier. "attached circuit"
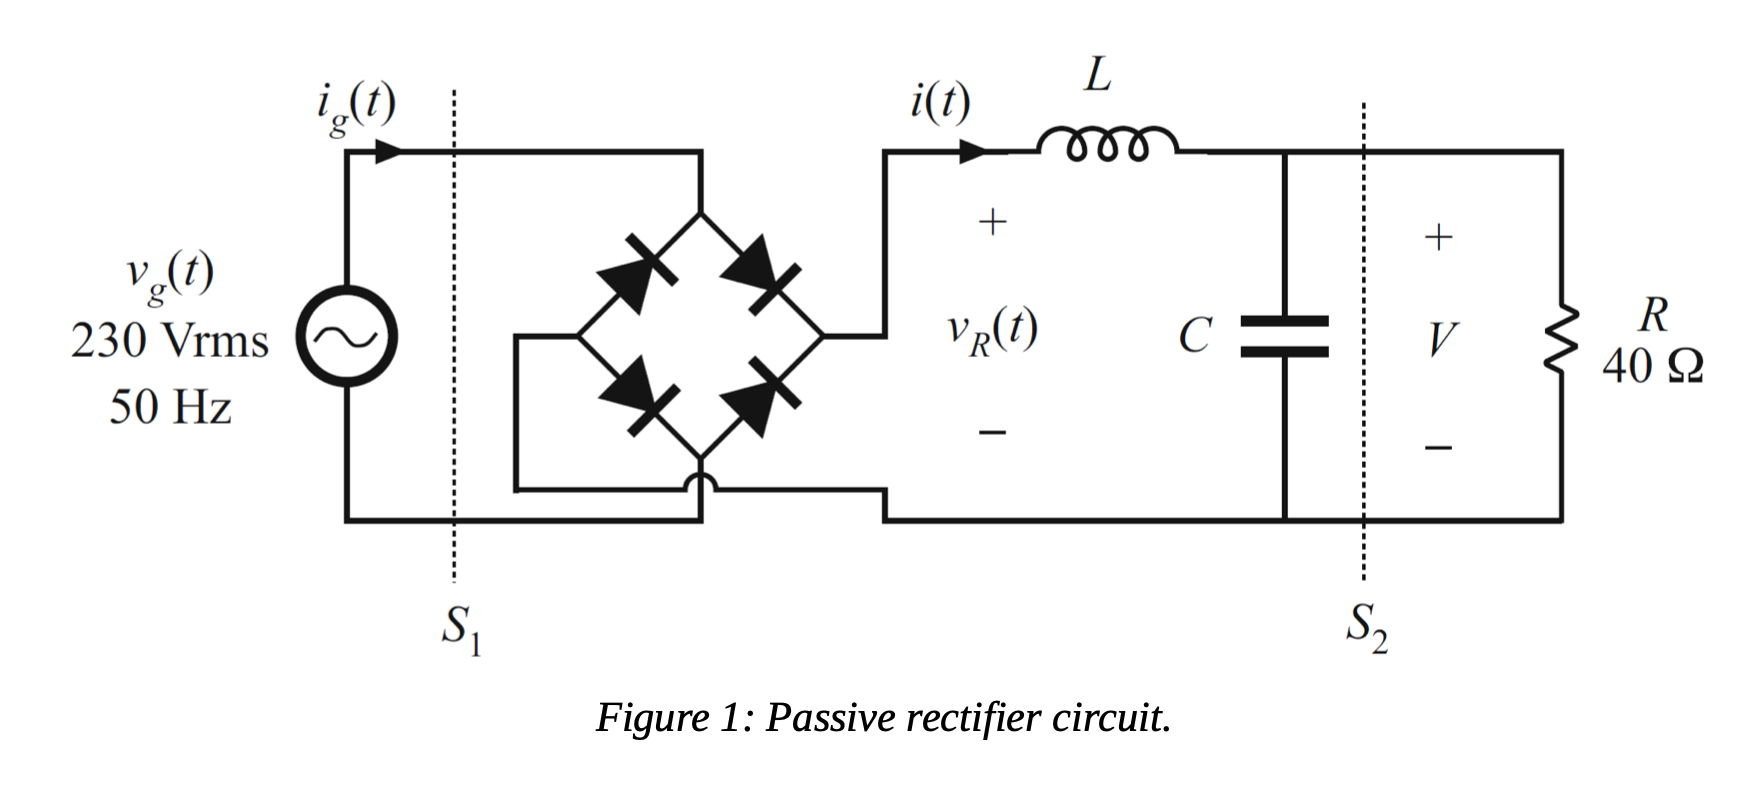
In the passive rectifier circuit of Fig. 1, L is very large (L = 500 mH), such that the inductor current i(t) is essentially dc. The capacitor C has a capacitance of 100 ?F. All components are ideal.
(a) Determine the average value of vR(t). Determine the dc output voltage V and the output current. (b) Find the average power delivered to the load.
(b) Sketch the ac line current waveform ig(t) and the rectifier output voltage waveform vR(t).
(c) Determine the ac line current rms magnitude, fundamental rms magnitude, and third harmonic rms magnitude. If it is required that the third harmonic magnitude of the ac line current be less than 2.3 A rms, would this rectifier network conform to regulations?
(d) Determine the power factor, measured at surfaces S1 and S2.
Notes:
In PSIM, you may obtain the amplitude, phase and freqüency of the harmonic content of any waveform visible in Simview. To do so, click the button ‘FFT’. Note, however, that the time period on screen (which by default is equal to: total time – print time) must be a perfect multiple of the time period of the waveforms. In other words, waveforms on screen must show an integer number of periods. Typically, a visualization of 5 to 10 periods yields good results. In addition, the time response must show steady state waveforms. That is, it should not present transients.
While in harmonic visualization, the length of the X axis corresponds to one half of the simulation time step. You may adjust the x axis with the X button on screen, to see the low frequency harmonic content.
In order to see the phases of the harmonics, you may click the ‘add curves’ button and select Angle. The names in the tab correspond to angles in degrees (D) or in radians (R).
Expert Answer
Firstly I am attaching the waveforms asked Now first let us derive all the standar