Home /
Expert Answers /
Economics /
for-each-of-the-following-scenarios-use-the-drag-tool-to-illustrate-what-happens-to-the-demand-curv-pa312
(Solved): For each of the following scenarios, use the drag tool to illustrate what happens to the demand curv ...
For each of the following scenarios, use the drag tool to illustrate what happens to the demand curve or the supply curve in the figure below.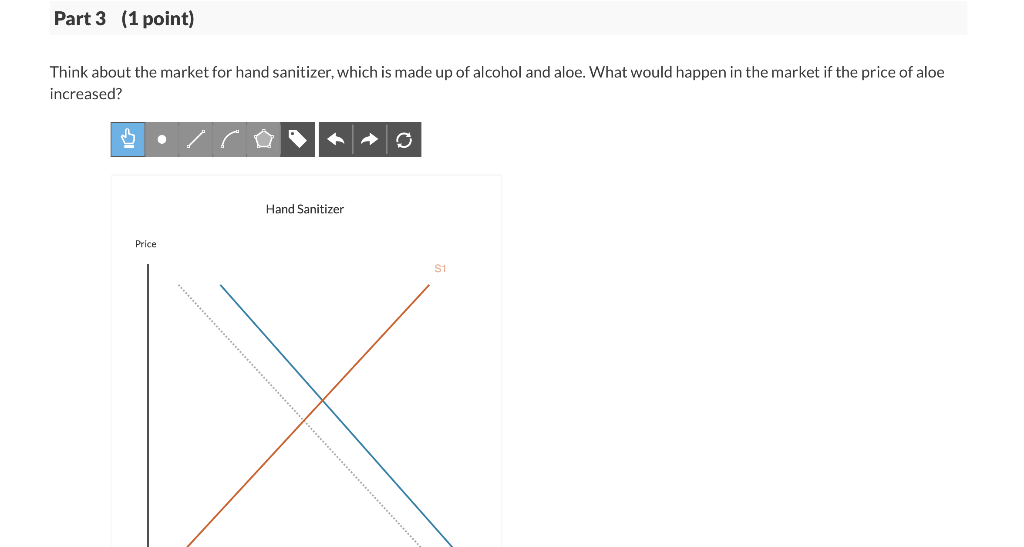

Suppose the federal government provides subsidies to hospitals to offset some of the additional costs of treating patients infected with COVID-19.
Think about the market for hand sanitizer, which is made up of alcohol and aloe. What would happen in the market if the price of aloe increased?