Home /
Expert Answers /
Economics /
for-the-second-question-its-the-same-graph-nbsp-consider-a-society-facing-the-production-possibilit-pa456
(Solved): for the second question its the same graph Consider a society facing the Production Possibilit ...
for the second question its the same graph
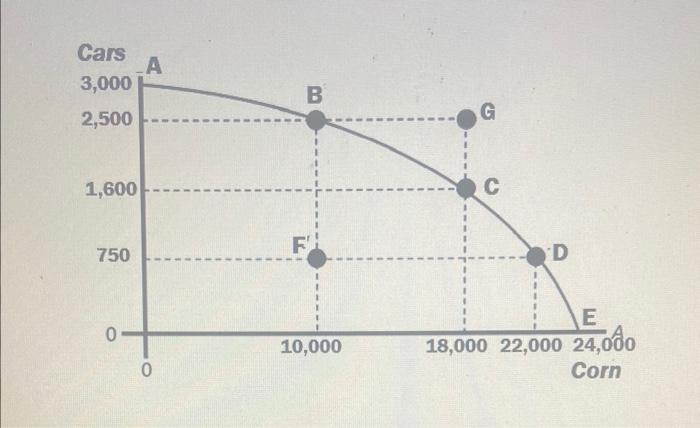
Consider a society facing the Production Possibilities Curve illustrated in Figure \( 2.1 \) and answer the question: If this society wanted to produce 1,000 units of cars, then their maximum output of corn would be
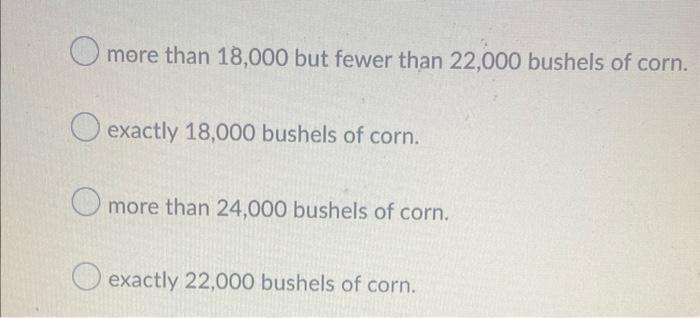
more than 18,000 but fewer than 22,000 bushels of corn. exactly 18,000 bushels of corn. more than 24,000 bushels of corn. exactly 22,000 bushels of corn.
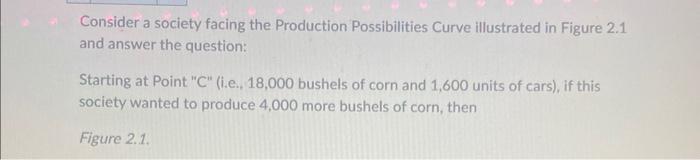
Consider a society facing the Production Possibilities Curve illustrated in Figure 2.1 and answer the question: Starting at Point "C" (i.e., 18,000 bushels of corn and 1,600 units of cars), if this society wanted to produce 4,000 more bushels of corn, then Figure 2.1.
they could also increase their output of cars by at least 900 units. they would have to decrease their output of cars by at least 850 units. they would have to decrease their output of cars by 600 units. they would no longer be able to produce any more bushels of corn.
Expert Answer
PPC shows the different combinations of two goods that an economy can produce with its given amount of factors or inputs. According to PPC, if producer produces 7