Home /
Expert Answers /
Economics /
graph-1-consider-the-diagram-below-depicting-the-typical-firm-in-a-competiti-pa404
(Solved): Graph 1. Consider the diagram below depicting the typical firm in a competiti ...
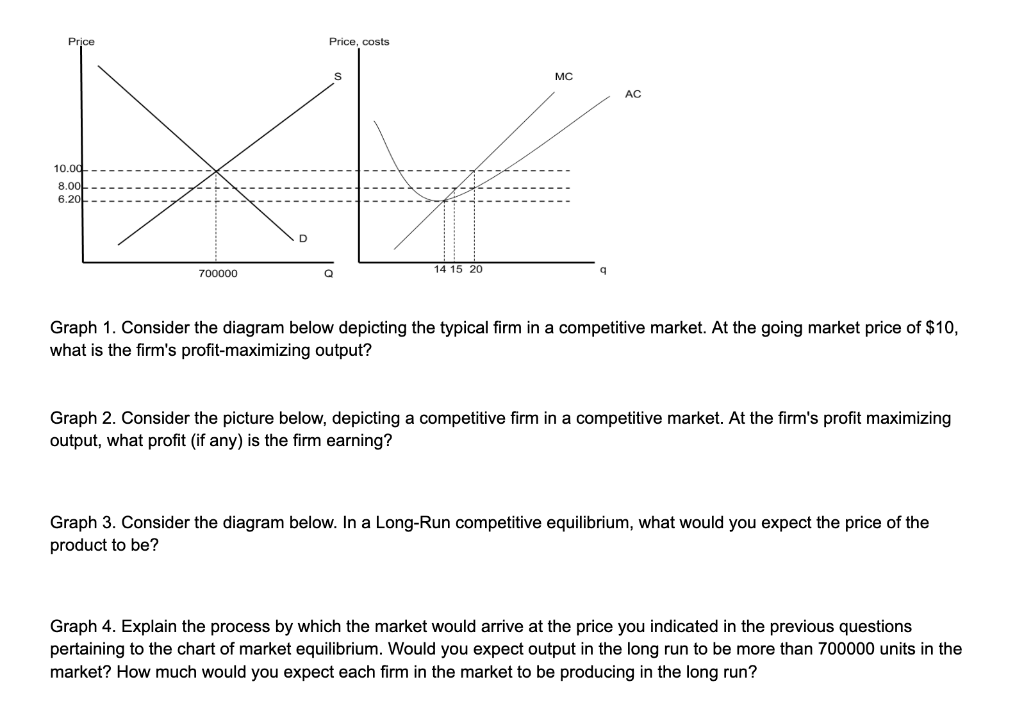
Graph 1. Consider the diagram below depicting the typical firm in a competitive market. At the going market price of \( \$ 10 \), what is the firm's profit-maximizing output? Graph 2. Consider the picture below, depicting a competitive firm in a competitive market. At the firm's profit maximizing output, what profit (if any) is the firm earning? Graph 3. Consider the diagram below. In a Long-Run competitive equilibrium, what would you expect the price of the product to be? Graph 4. Explain the process by which the market would arrive at the price you indicated in the previous questions pertaining to the chart of market equilibrium. Would you expect output in the long run to be more than 700000 units in the market? How much would you expect each firm in the market to be producing in the long run?
Expert Answer
1. At market price of $10, firm's profit maximizing output is 20 2. At firm's profit maximizing output, 20 units, firm's profit= p*q - (AC*q) = 10(20)