Home /
Expert Answers /
Advanced Math /
help-me-solve-these-2-questions-each-question-has-3-sub-questions-a-b-and-c-consider-pa793
(Solved): help me solve these 2 questions. each question has 3 sub questions (a),(b) and (c) Consider ...

help me solve these 2 questions. each question has 3 sub questions (a),(b) and (c)
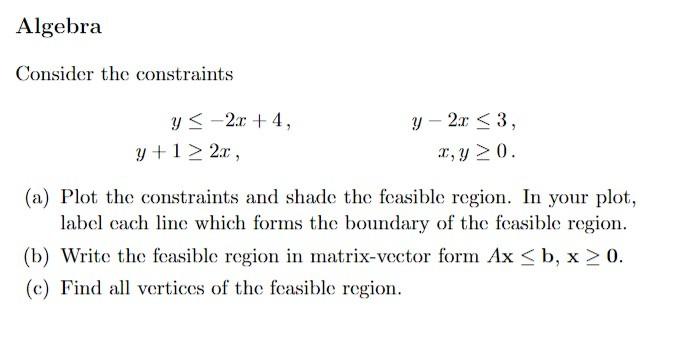
Consider the constraints (a) Plot the constraints and shade the feasible region. In your plot, label each line which forms the boundary of the feasible region. (b) Write the feasible region in matrix-vector form . (c) Find all vertices of the feasible region.
In this question we will use the method of slack variables to find the vertices of the feasible region defined by the inequalities (a) Write down the linear system obtained from this system of inequalities by adding non-negative slack variables. (b) Use Gauss-Jordan elimination to find the basic solutions corresponding to the basic variables: (i) ; (ii) ; (iii) . (c) The remaining basic solutions are and . Using your answers as well as these, list the vertices of the region.
Expert Answer
To solve this problem, we'll follow the given steps:(a) Plotting the constraints and shading the feasible region:First, let's rearrange the inequalities in the standard form: To plot the constraints, we need to find the corresponding lines and shade the feasible region where all the constraints are satisfied.Let's plot each constraint one by one:y - 2x ? -4: To find this line, we set y - 2x equal to -4 and plot it as an equality. Rearranging the equation, we get y = 2x - 4. We can then draw this line on the graph.y - 2x ? 3: Rearranging the equation, we get y = 2x + 3. We can draw this line on the graph.y + 1 ? 2x: Rearranging the equation, we get y ? 2x - 1. We can draw this line on the graph as a dashed line since it's an inequality with a "greater than or equal to" sign.x ? 0: This constraint simply represents the x-axis, so we draw a vertical line at x = 0.y ? 0: This constraint represents the y-axis, so we draw a horizontal line at y = 0.Now, let's shade the feasible region:The feasible region is the region that satisfies all the constraints simultaneously. To shade it, we need to identify the area that satisfies all the constraints. This region is the intersection of all the shaded areas from the individual constraints.After plotting all the lines, we shade the region that satisfies all the inequalities. The feasible region is the shaded area on the graph.