Home /
Expert Answers /
Statistics and Probability /
help-will-all-please-listed-in-the-accompanying-table-are-waiting-times-seconds-of-observed-cars-a-pa459
(Solved): Help will all please Listed in the accompanying table are waiting times (seconds) of observed cars a ...
Help will all please
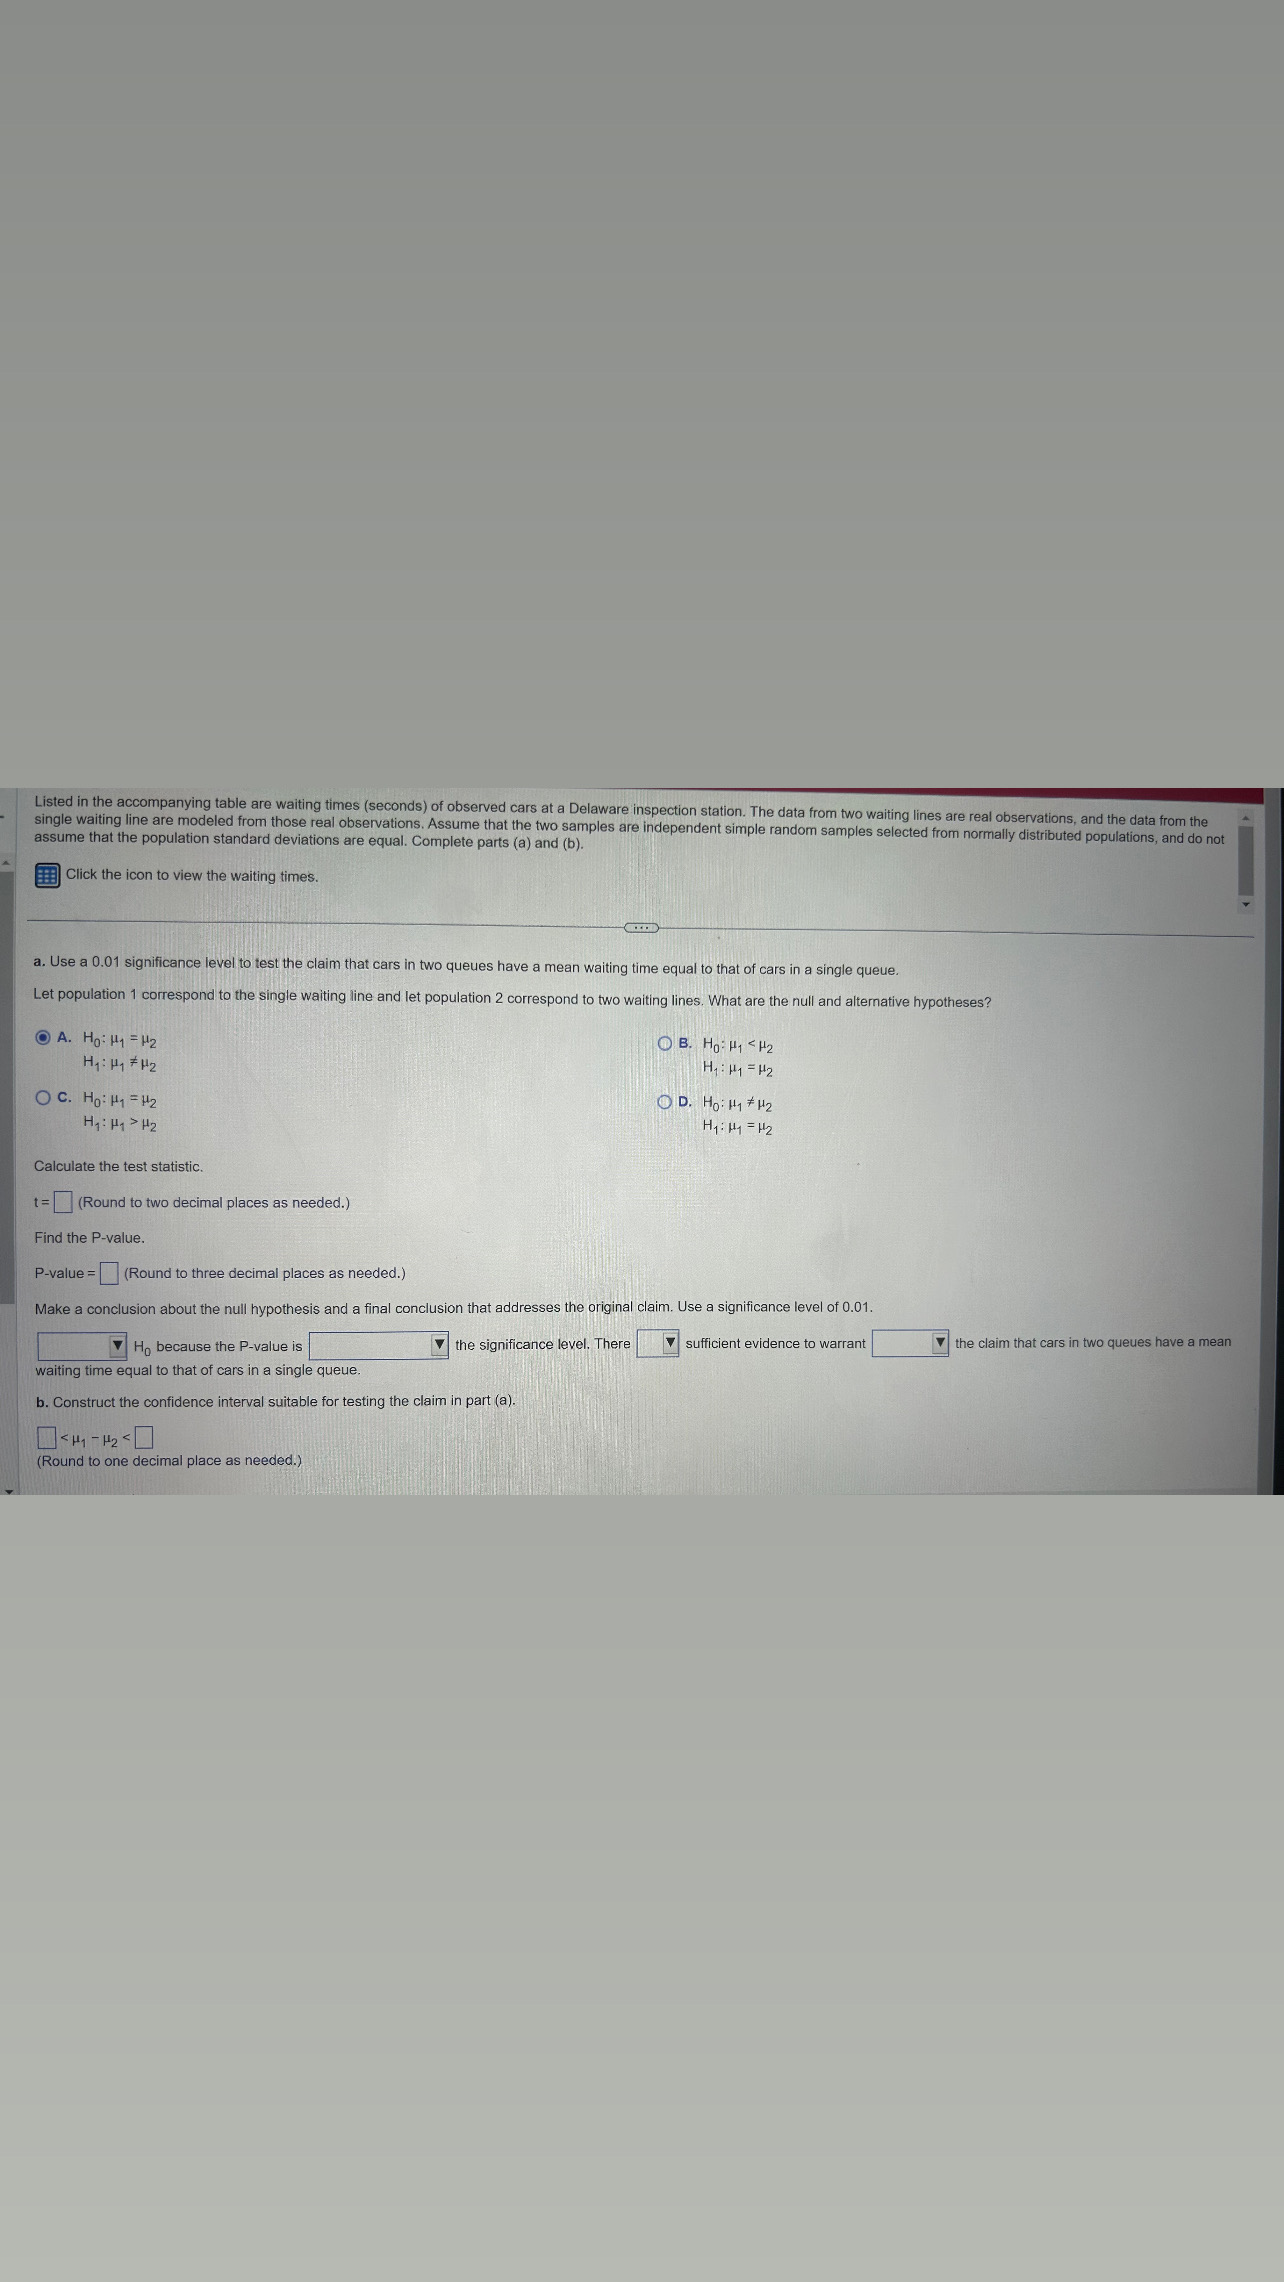
Listed in the accompanying table are waiting times (seconds) of observed cars at a Delaware inspection station. The data from two waiting lines are real observations, and the data from the single waiting line are modeled from those real observations. Assume that the two samples are independent simple random samples selected from normally distributed populations, and do not assume that the population standard deviations are equal. Complete parts (a) and (b). Click the icon to view the waiting times. a. Use a 0.01 significance level to test the claim that cars in two queues have a mean waiting time equal to that of cars in a single queue. Let population 1 correspond to the single waiting line and let population 2 correspond to two waiting lines. What are the null and alternative hypotheses? A. 2. B. D. Calculate the test statistic. (Round to two decimal places as needed.) Find the P-value. (Round to three decimal places as needed.) Make a conclusion about the null hypothesis and a final conclusion that addresses the original claim. Use a significance level of 0.01 . because the P-value is the significance level. There sufficient evidence to warrant the claim that cars in two queues have a mean waiting time equal to that of cars in a single queue. b. Construct the confidence interval suitable for testing the claim in part (a). (Round to one decimal place as needed.)
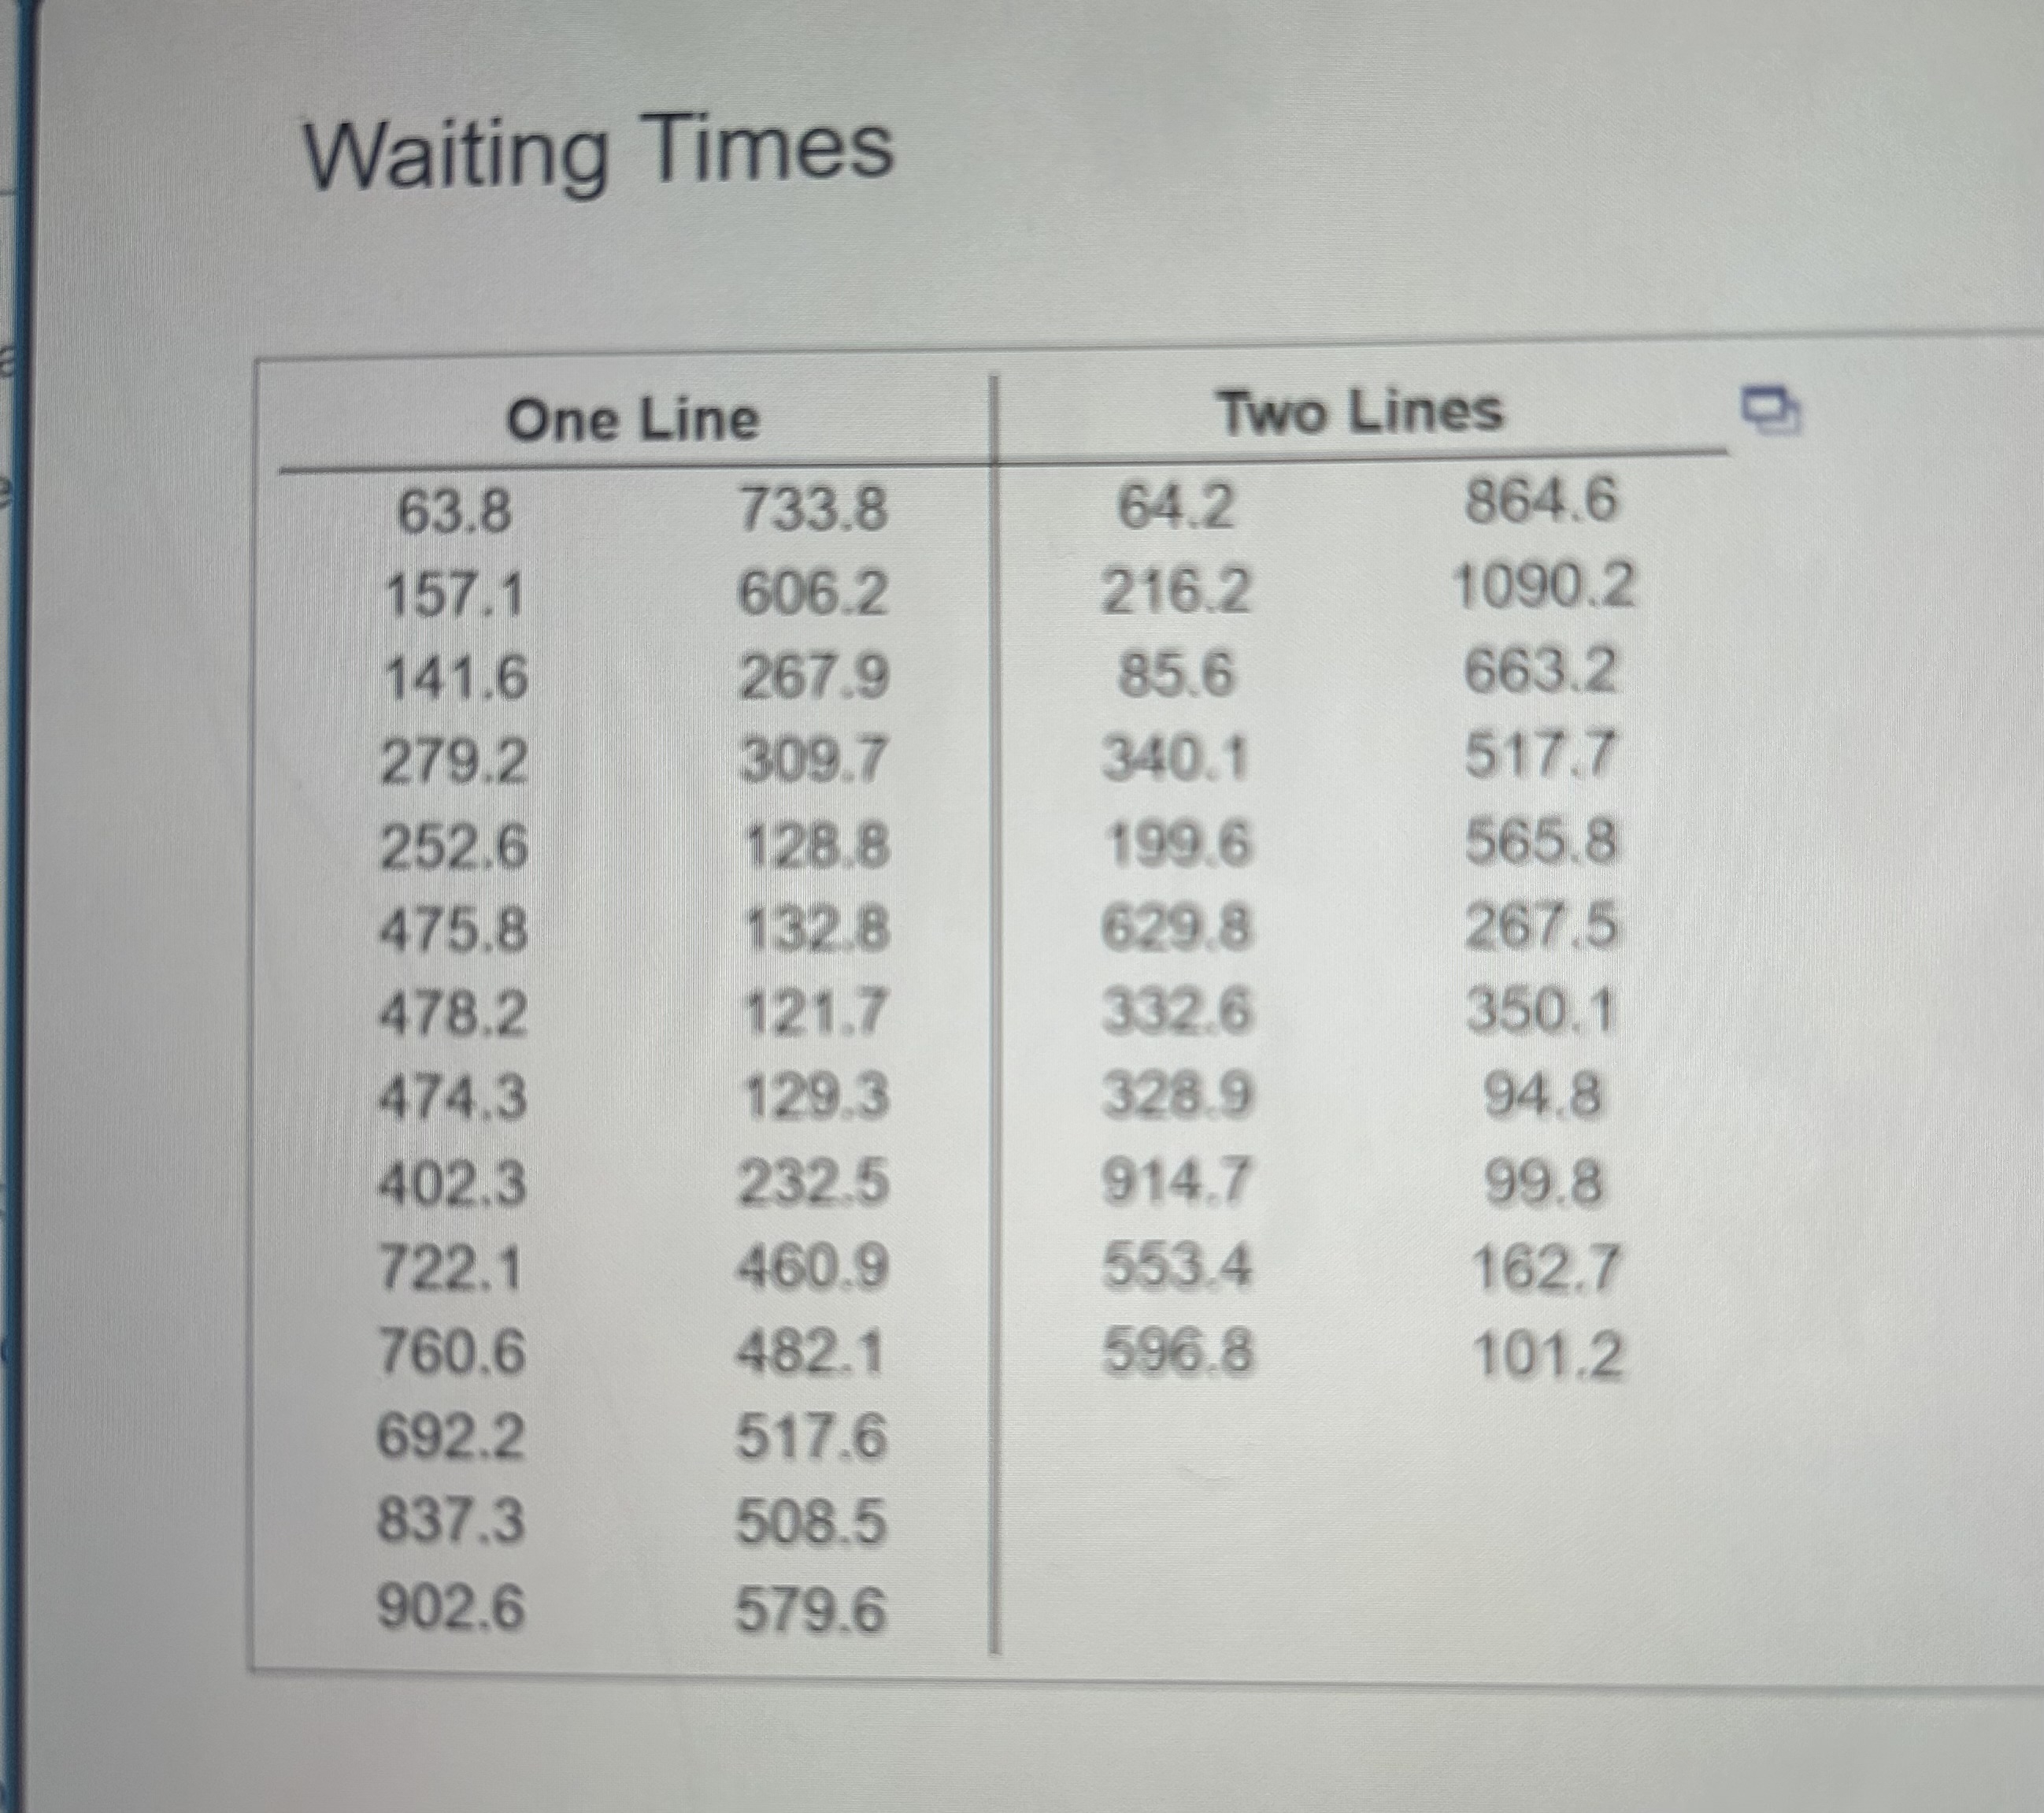
Waiting Times