Home /
Expert Answers /
Statistics and Probability /
here-is-a-data-set-that-illustrates-an-important-point-about-correlation-x-45-55-65-75-85-y-30-50-pa149
(Solved): Here is a data set that illustrates an important point about correlation: X 45 55 65 75 85 Y 30 50 ...
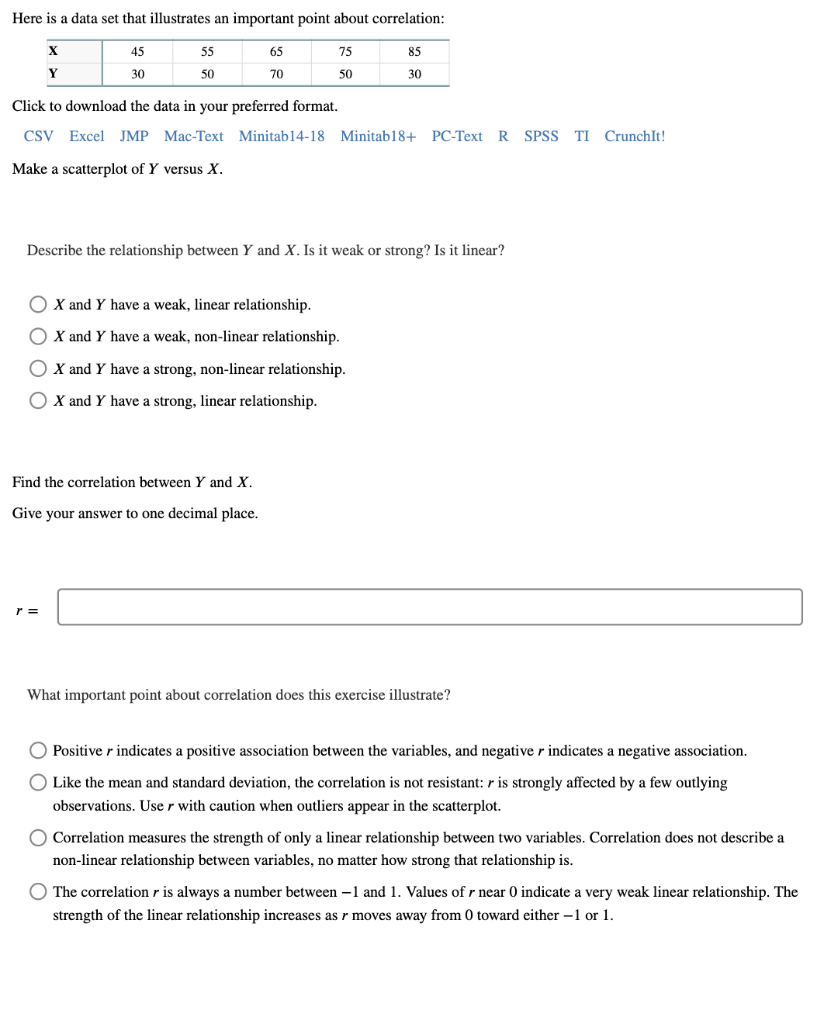
Here is a data set that illustrates an important point about correlation: X 45 55 65 75 85 Y 30 50 70 50 30 Click to download the data in your preferred format. CSV Excel JMP Mac-Text Minitab14-18 Minitab18+ PC-Text R SPSS TI CrunchIt! Make a scatterplot of Y versus X. Describe the relationship between Y and X. Is it weak or strong? Is it linear? O X and Y have a weak, linear relationship. O X and Y have a weak, non-linear relationship. O X and Y have a strong, non-linear relationship. O X and Y have a strong, linear relationship. Find the correlation between Y and X. Give your answer to one decimal place. r = What important point about correlation does this exercise illustrate? O Positive r indicates a positive association between the variables, and negative r indicates a negative association. O Like the mean and standard deviation, the correlation is not resistant: r is strongly affected by a few outlying observations. User with caution when outliers appear in the scatterplot. O Correlation measures the strength of only a linear relationship between two variables. Correlation does not describe a non-linear relationship between variables, no matter how strong that relationship is. O The correlation r is always a number between 1 and 1. Values of r near 0 indicate a very weak linear relationship. The strength of the linear relationship increases as r moves away from 0 toward either -1 or 1.
Expert Answer
The given data is given to Excel, and by selecting the data go to insert tab and find the scatter plot from the charts. We get the scatter pl