(Solved): Income Levels and Years of School The chart below depicts levels of income and the years of schoolin ...
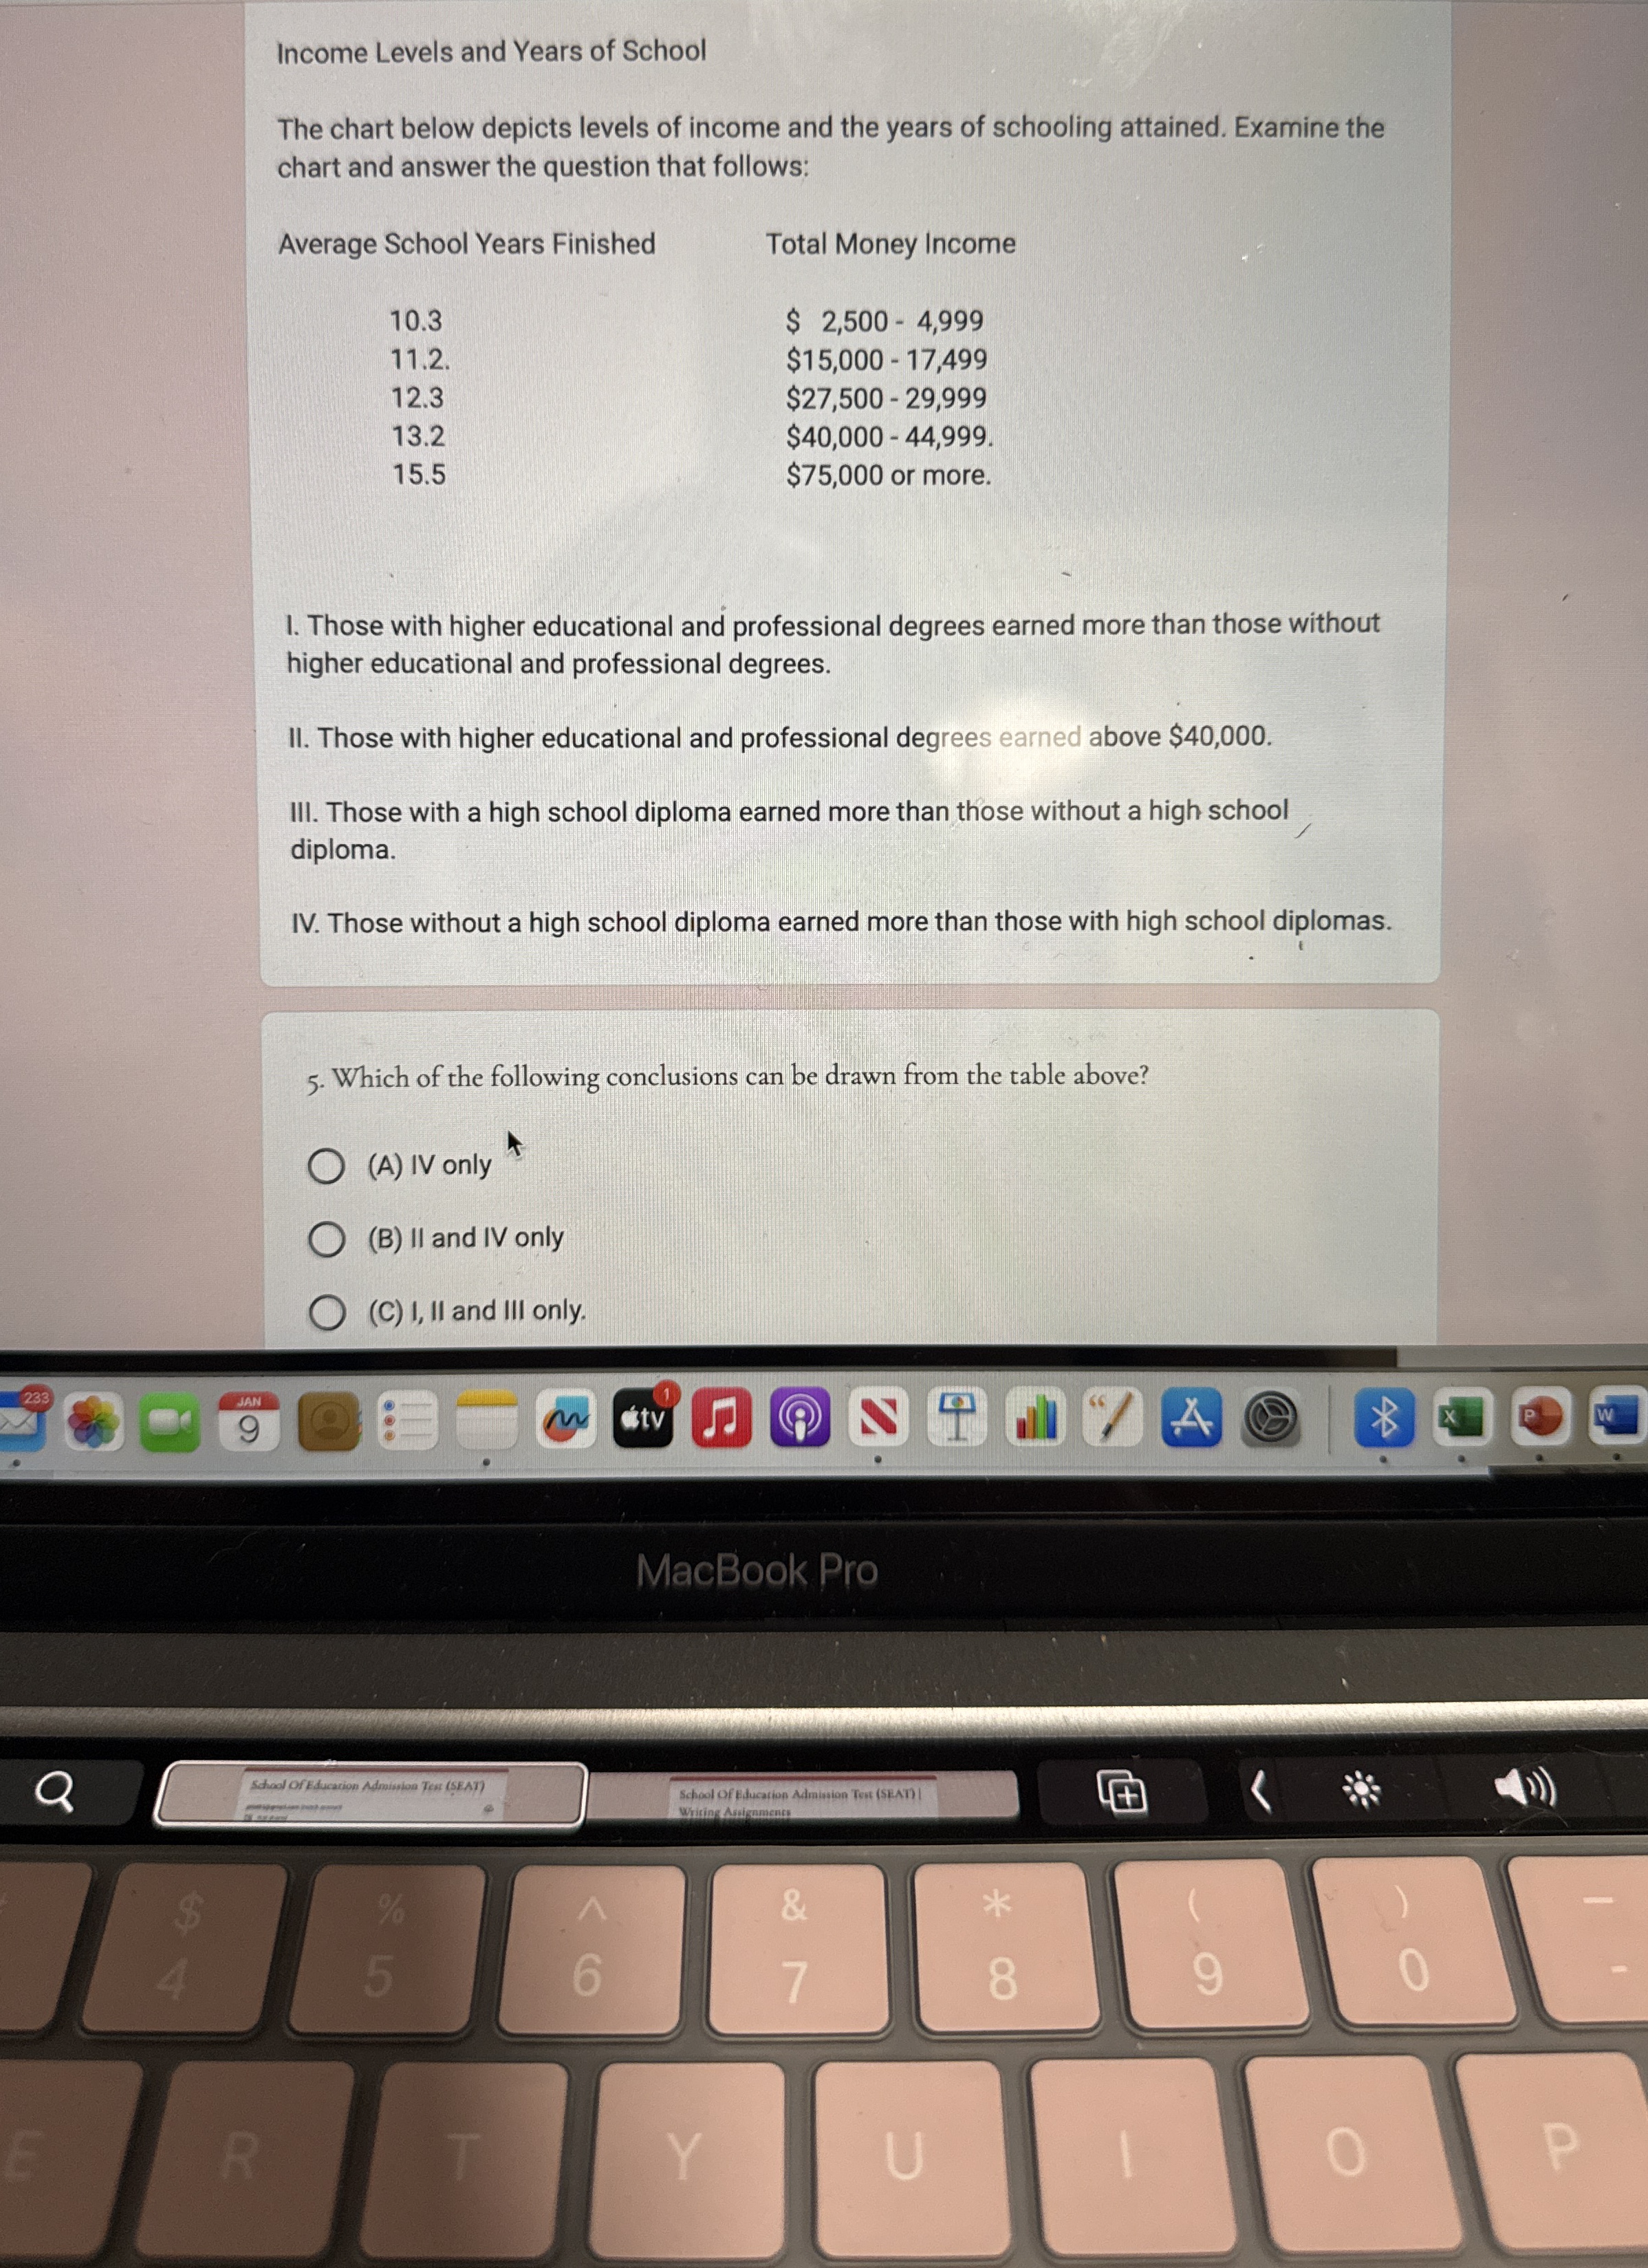
Income Levels and Years of School The chart below depicts levels of income and the years of schooling attained. Examine the chart and answer the question that follows: Average School Years Finished 10.3 11.2 . 12.3 13.2 15.5 Total Money Income
$2,500-4,999
$15,000-17,499
$27,500-29,999
$40,000-44,999.
$75,000or more. $
2,500-4,999$15,000-17,499 $27,500-29,999 $40,000-44,999.
$75,000or more. Those with higher educational and professional degrees earned more than those without higher educational and professional degrees. II. Those with higher educational and professional degrees earned above
$40,000. III. Those with a high school diploma earned more than those without a high school diploma. IV. Those without a high school diploma earned more than those with high school diplomas. Which of the following conclusions can be drawn from the table above? (A) IV only (B) II and IV only (C) I, II and III only.