Home /
Expert Answers /
Electrical Engineering /
lab-objective-to-plot-the-continuous-time-fourier-series-of-signals-in-matlab-1-compute-the-trigo-pa649
(Solved): Lab Objective: To plot the continuous-time Fourier series of signals in MATLAB 1) Compute the trigo ...
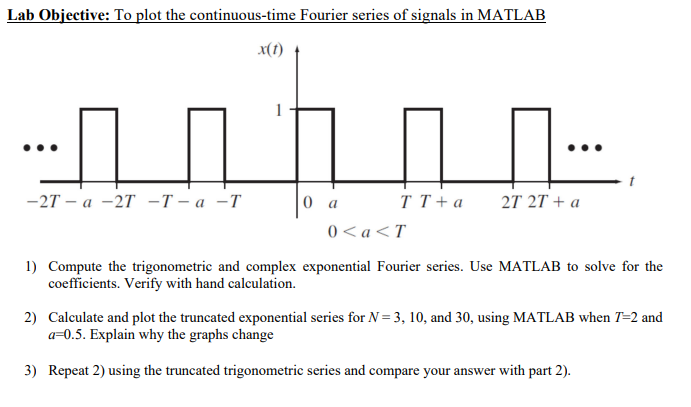
Lab Objective: To plot the continuous-time Fourier series of signals in MATLAB 1) Compute the trigonometric and complex exponential Fourier series. Use MATLAB to solve for the coefficients. Verify with hand calculation. 2) Calculate and plot the truncated exponential series for , and 30 , using MATLAB when and . Explain why the graphs change 3) Repeat 2) using the truncated trigonometric series and compare your answer with part 2).
Expert Answer
To achieve the objectives stated, we will go through each step individually. Step 1: Computing Trigonometric and Complex Exponential Fourier Series Let's assume we have a continuous-time signal with period and fundamental frequency . The trigonometric Fourier series representation of is given by where an and bn are the Fourier coefficients given by the following formulas: Similarly, the complex exponential Fourier series representation of is where cn represents the complex Fourier coefficients and is calculated as: To compute these coefficients numerically using MATLAB, we'll need to have the expression for x(t) and perform integration. Once we have the coefficients, we can plot the Fourier series representation.