(Solved): Make each of the following statements independent. (Each statement is not related to each other.) Co ...
Make each of the following statements independent. (Each statement is not related to each other.) Consider whether the following statement is true
(T)or false (False
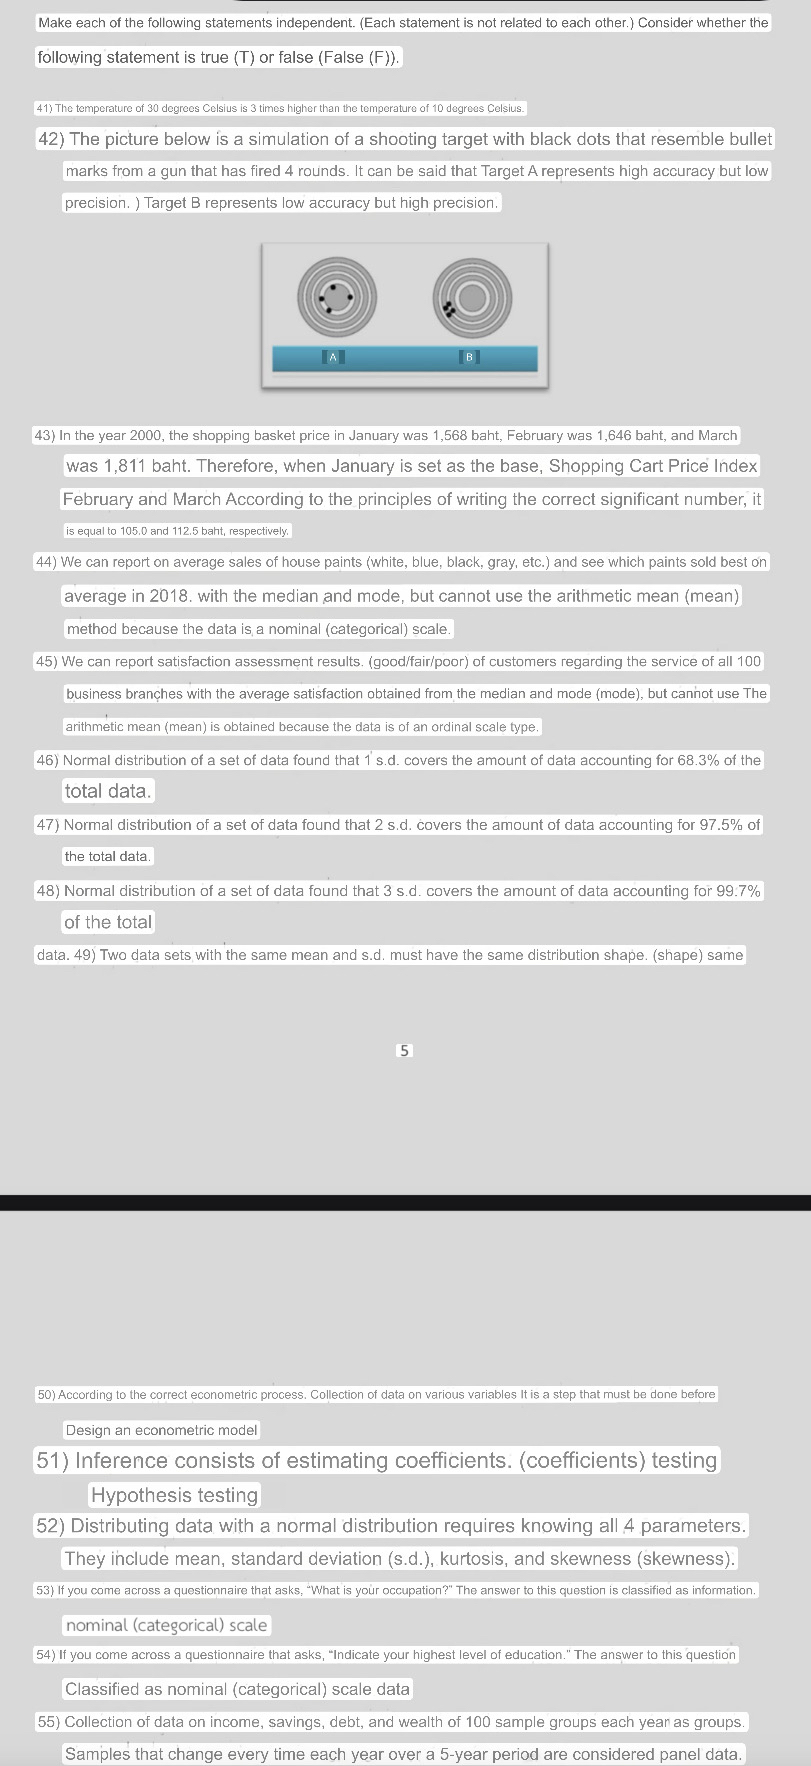
(F)). The temperature of 30 degrees Celsius is 3 times higher than the temperature of 10 degrees Celsius. The picture below is a simulation of a shooting target with black dots that resemble bullet marks from a gun that has fired 4 rounds. It can be said that Target A represents high accuracy but low precision. ) Target B represents low accuracy but high precision. In the year 2000, the shopping basket price in January was 1,568 baht, February was 1,646 baht, and March was 1,811 baht. Therefore, when January is set as the base, Shopping Cart Price Index February and March According to the principles of writing the correct significant number, it is equal to 105.0 and 112.5 baht, respectively We can report on average sales of house paints (white, blue, black, gray, etc.) and see which paints sold best ón average in 2018. with the median and mode, but cannot use the arithmetic mean (mean) method because the data is a nominal (categorical) scale. We can report satisfaction assessment results. (good/fair/poor) of customers regarding the service of all 100 business branches with the average satisfaction obtained from the median and mode (mode), but cannot use The arithmetic mean (mean) is obtained because the data is of an ordinal scale type. Normal distribution of a set of data found that 1 s.d. covers the amount of data accounting for
68.3%of the total data. Normal distribution of a set of data found that 2 s.d. covers the amount of data accounting for
97.5%of
◻Normal distribution of a set of data found that 3 s.d. covers the amount of data accounting for
99.7%of the total data. 49) Two data sets with the same mean and s.d. must have the same distribution shape. (shape) same 5 According to the correct econometric process. Collection of data on various variables It is a step that must be done before Design an econometric model Inference consists of estimating coefficients. (coefficients) testing Hypothesis testing Distributing data with a normal distribution requires knowing all 4 parameters. They include mean, standard deviation (s.d.), kurtosis, and skewness (skewness). If you come across a questionnaire that asks, "What is your occupation?" The answer to this question is classified as information. nominal (categorical) scale If you come across a questionnaire that asks, "Indicate your highest level of education." The answer to this question Classified as nominal (categorical) scale data Collection of data on income, savings, debt, and wealth of 100 sample groups each yean as groups. Samples that change every time each year over a 5 -year period are considered panel data.