(Solved): MAT107 Intro to Statistics Project INDEX Name q, Distracted Study Time q, Project Part 2 due (7) ...
MAT107 Intro to Statistics Project INDEX Name
q,Distracted Study Time
◻
q,Project Part 2 due
(7)/(26)
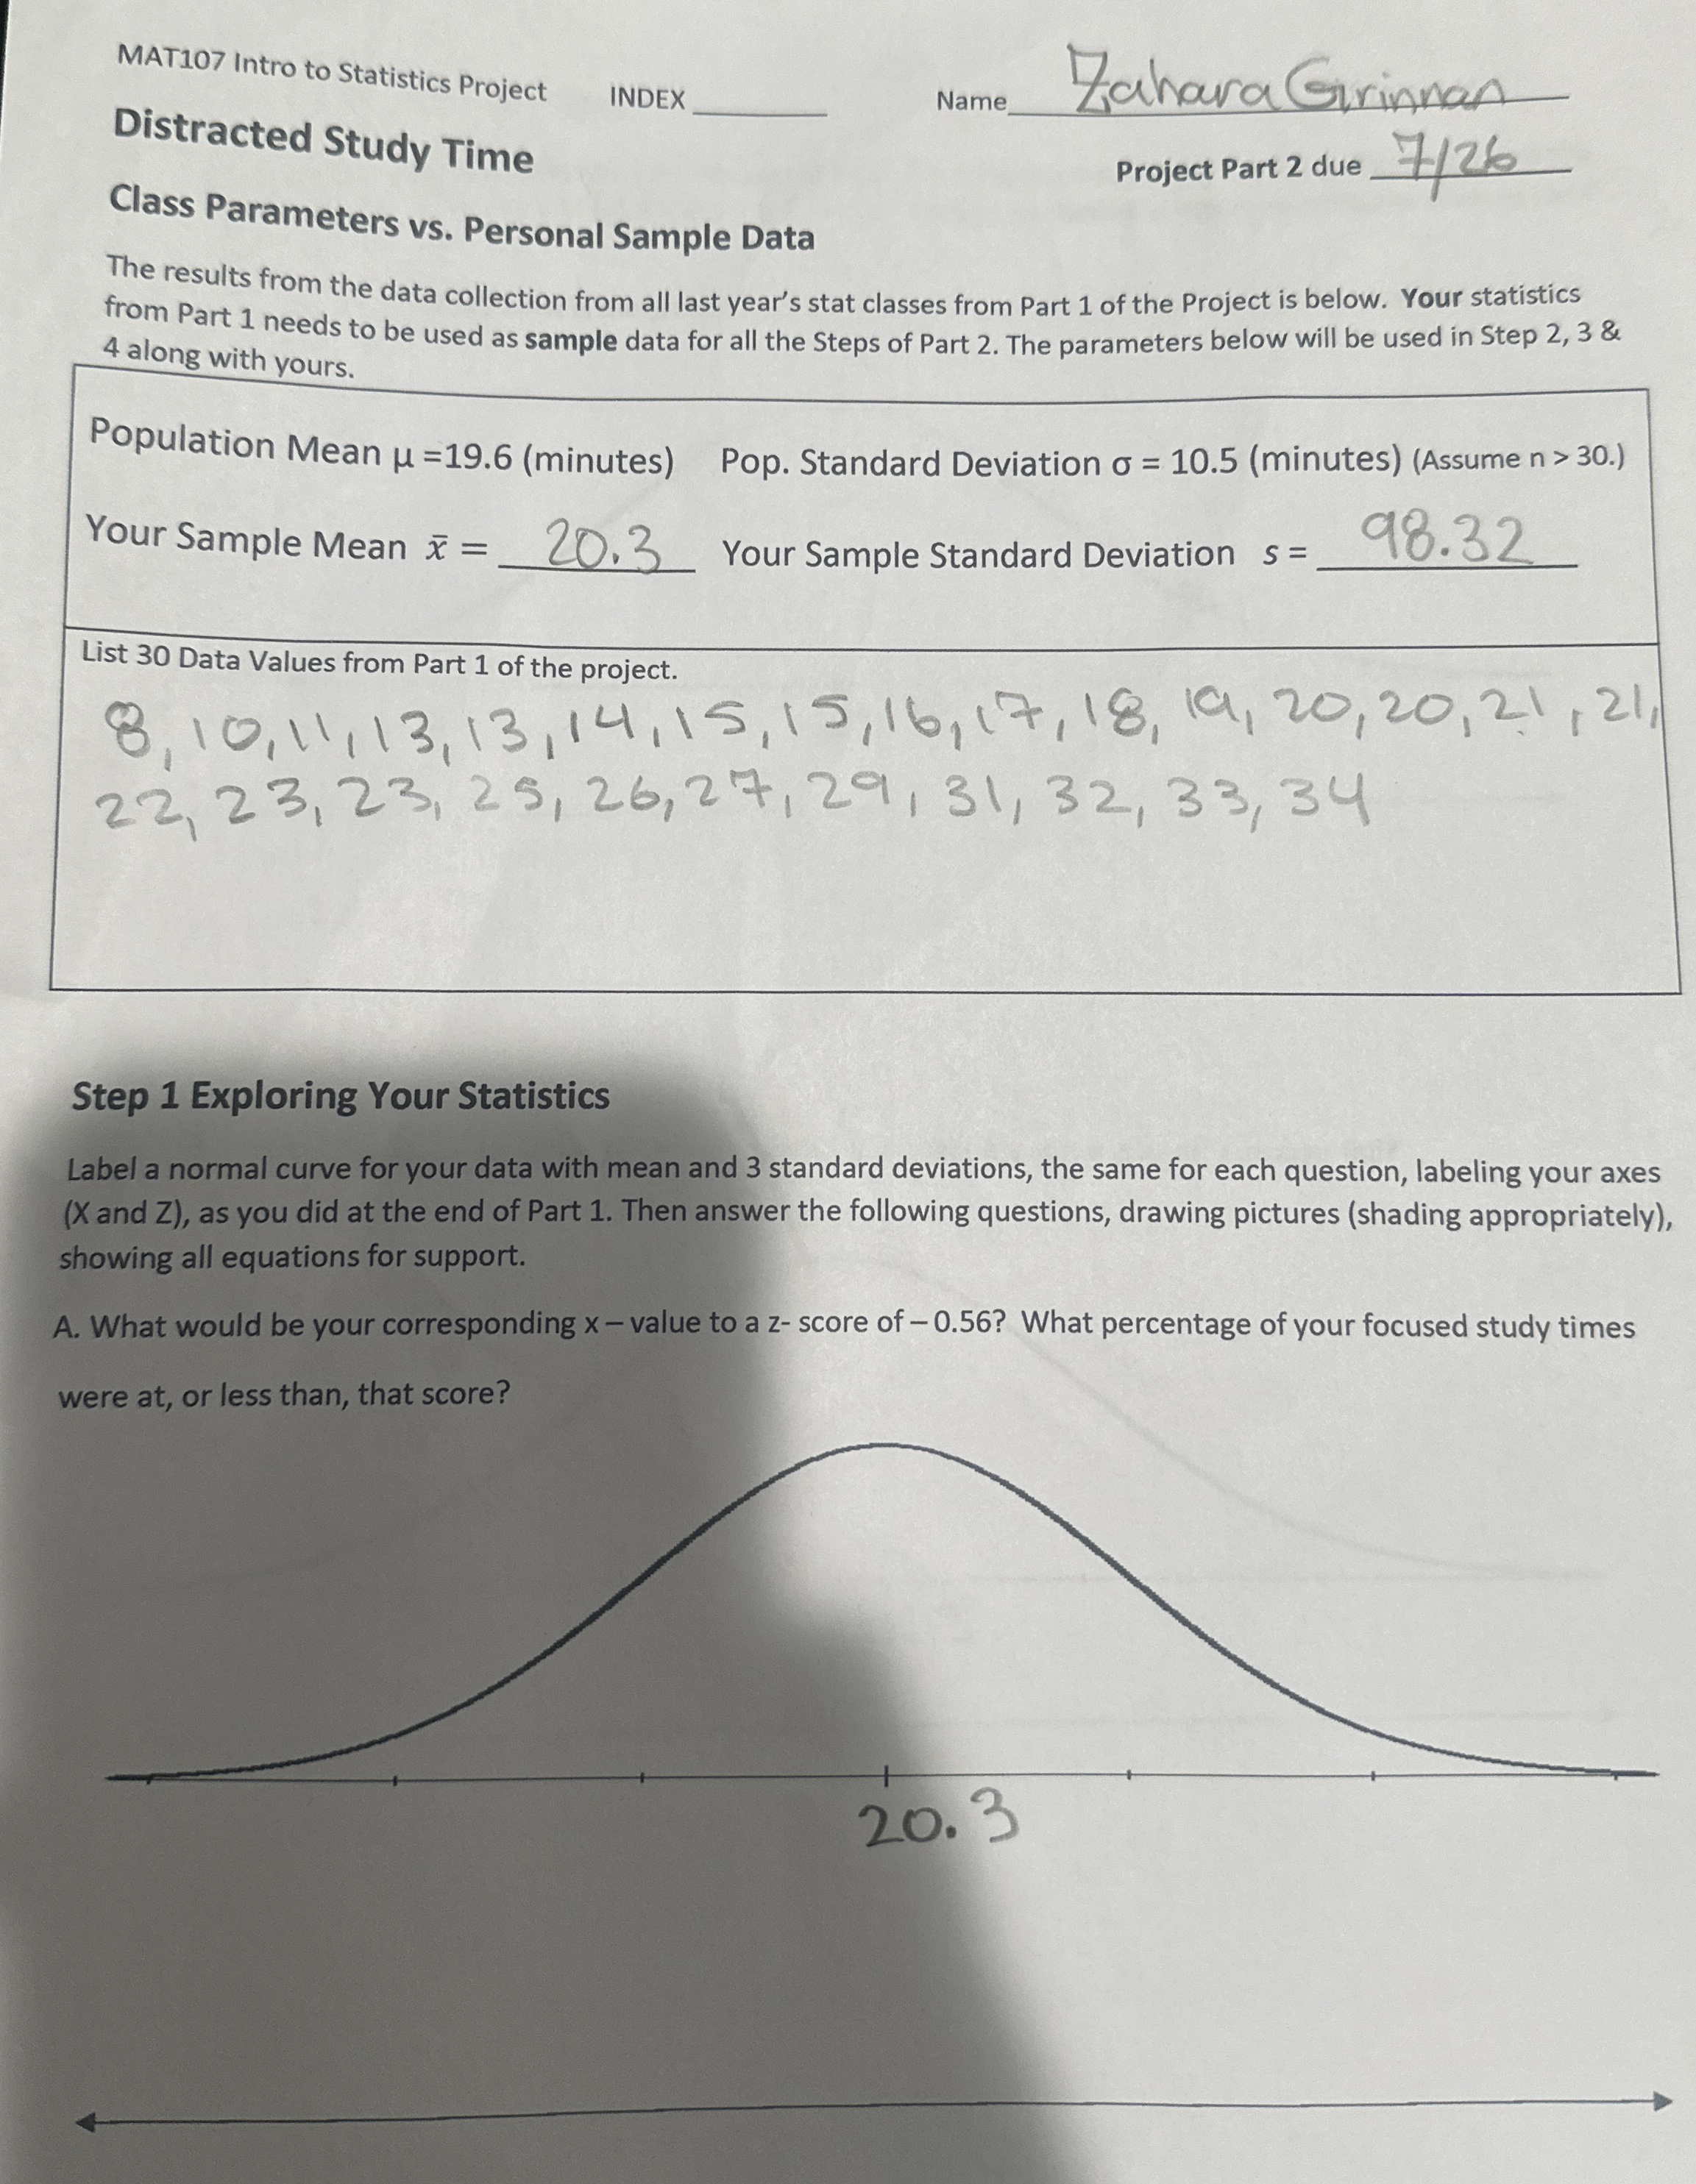
q,Class Parameters vs. Personal Sample Data The results from the data collection from all last year's stat classes from Part 1 of the Project is below. Your statistics from Part 1 needs to be used as sample data for all the Steps of Part 2. The parameters below will be used in Step 2, 3 & 4 along with yours. Population Mean
\mu =19.6(minutes) Pop. Standard Deviation
\sigma =10.5(minutes) (Assume
n>30.) Your Sample Mean
\bar{x} =20.3List 30 Data Values from Part 1 of the project. List 3
q,98.32 Your Sample Standard Deviation
s=
q,
q,
q,Step 1 Exploring Your Statistics Label a normal curve for your data with mean and 3 standard deviations, the same for each question, labeling your axes ( X and Z ), as you did at the end of Part 1. Then answer the following questions, drawing pictures (shading appropriately), showing all equations for support. A. What would be your corresponding
x- value to a
z- score of -0.56 ? What percentage of your focused study times were at, or less than, that score?