Home /
Expert Answers /
Computer Science /
matlab-work-pls-if-your-code-is-correct-the-output-should-resemble-the-figure-below-note-that-yo-pa987
(Solved): matlab work pls If your code is correct, the output should resemble the figure below. Note that yo ...
matlab work pls
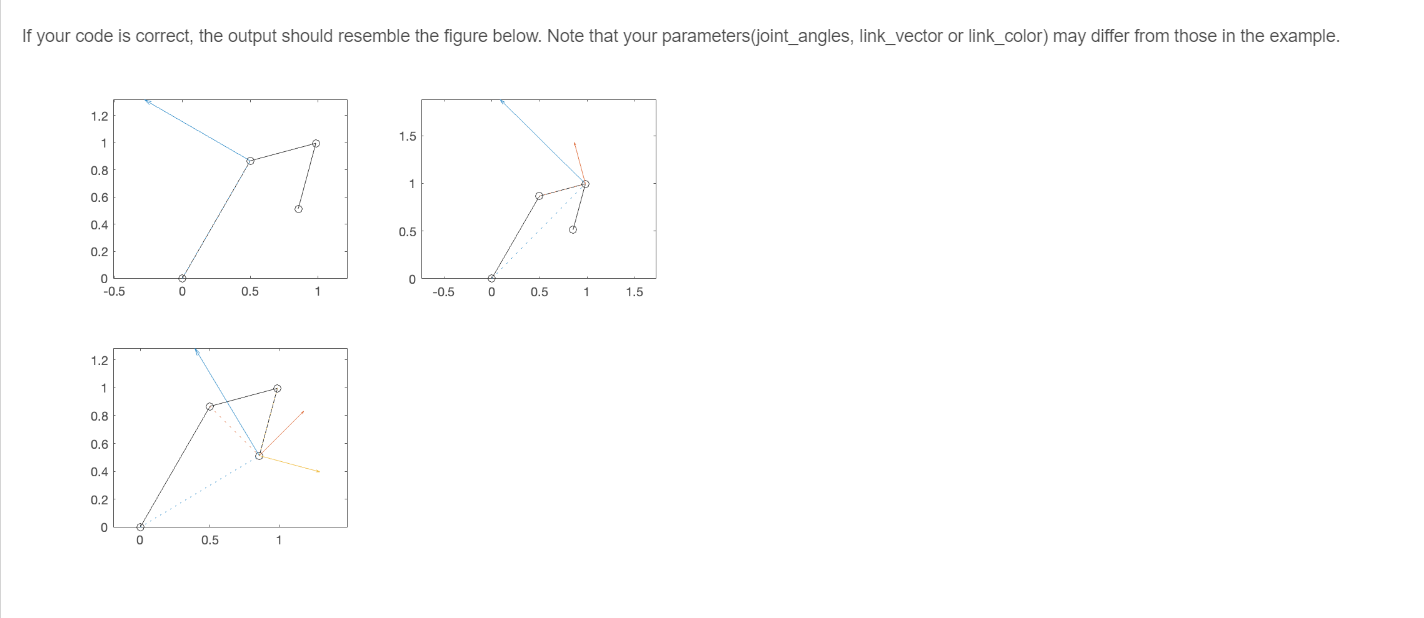
If your code is correct, the output should resemble the figure below. Note that your parameters(joint_angles, link_vector or link_color) may differ from those in the example.
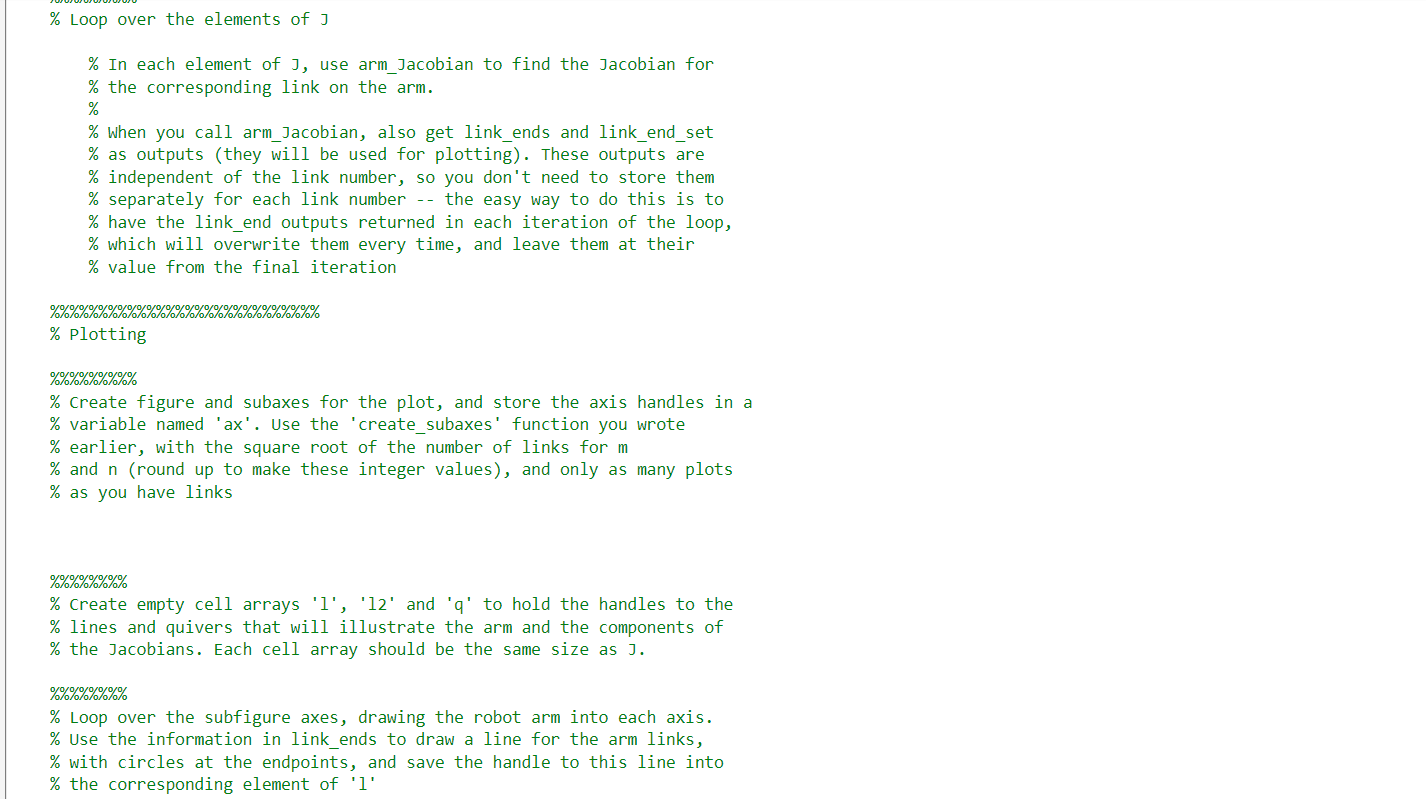
\% Loop over the elements of J \% In each element of , use arm_Jacobian to find the Jacobian for the corresponding link on the arm. \% When you call arm_Jacobian, also get link_ends and link_end_set as outputs (they will be used for plotting). These outputs are independent of the link number, so you don't need to store them separately for each link number -- the easy way to do this is to have the link_end outputs returned in each iteration of the loop, which will overwrite them every time, and leave them at their value from the final iteration Plotting create figure and subaxes for the plot, and store the axis handles in a variable named 'ax'. Use the 'create_subaxes' function you wrote earlier, with the square root of the number of links for and (round up to make these integer values), and only as many plots as you have links Create empty cell arrays ' 1 ', ' 12 ' and ' ' to hold the handles to the lines and quivers that will illustrate the arm and the components of the Jacobians. Each cell array should be the same size as . \% Loop over the subfigure axes, drawing the robot arm into each axis. Use the information in link_ends to draw a line for the arm links, with circles at the endpoints, and save the handle to this line into the corresponding element of ' '
\%\%\%\%\%\% Loop over the subfigure axes, drawing the robot arm into each axis. Use the information in link_ends to draw a line for the arm links, with circles at the endpoints, and save the handle to this line into the corresponding element of ' 1 ' \% Loop over the subfigure axes, adding arrows for the column of the corresponding Jacobian into each axis. Get the location of the end of the link from link_end_set, and use the draw_vectors_at_point function you wrote earlier to make the arrows. Save . returned by draw_vectors_at_point into the corresponding elements of Loop over the subfigure axes, adding a dotted line between the end of the link whose Jacobian is plotted in that axis and the joints corresponding to the columns of the Jacobian \% For each subfigure axis: 1. Make the corresponding element of ' 12 ' an empty cell array (where is the number of columns in the Jacobian). This is now a nested cell array, so your command should look something like ' ' 2. Loop over the locations of the joints (the base points of the links), and draw a dotted line from each of the joints that is *before* the current link to the end of the current link Save the handles to these lines into the cell array you created for this plot (note that because this is a nested cell array, your command should look something like idx idx 2 line
Save the handles to these lines into the cell array you created for this plot (note that because this is a nested cell array, your command should look something like \( \% \quad ' 12\{ \) idx idx 2 As you make these lines, set their color property to be the same as the corresponding Jacobian arrow [Use get , 'Color') to get the color of the arrow]
Make a set of plot of a 3-link arm, overlaid with its Jacobians. The arm links should be , and 0.5 units long. Each should be along the axis of its local frame, and the joint angles between the link frames should be , and . Your figure should have three subplots. In each subplot, the arrows for the columns of the corresponding link's Jacobian should be placed at the end of that link, and there should be dotted lines from the joints that are before that link to the end of the link. When the lines and arrows are calculated and plotted correctly, the vectors will be at right angles to the lines connecting the link end to the corresponding joints. In addition to standard Matlab functions, your code may assume that you have access to the functions you created in previous assignments (some of these you will call directly in this assignment, some will only be called by other functions that you call). Remember that for these functions, the grading script will use the instructor's copy of the functions: - vector_set_rotate - vector_set_cumulative_sum - vector_set_difference - rotation_set_cumulative_product - threeD_rotation_set - threeD_robot_arm_endpoints - threeD_joint_axis_set - - Ry - - create_subaxes - arm_Jacobian - draw_vectors_at_point If your code is correct, the output should resemble the figure below. Note that your parameters(joint_angles, link_vector or link_color) may differ from those in the example.
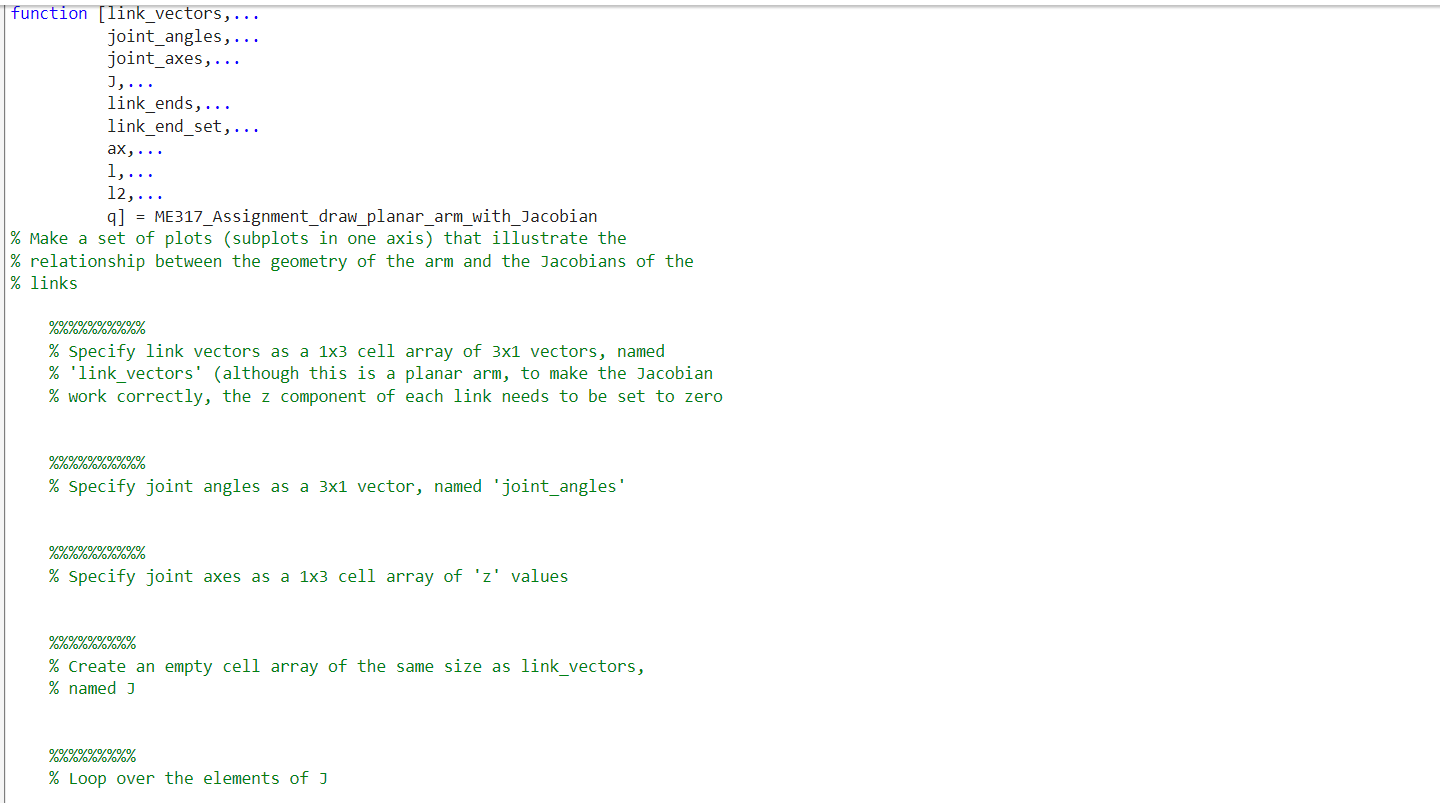
function [link_vectors,... joint_angles,... joint_axes,... J,... link_ends,... link_end_set,... q] = ME317_Assignment_draw_planar_arm_with_Jacobian Make a set of plots (subplots in one axis) that illustrate the relationship between the geometry of the arm and the Jacobians of the links specify link vectors as a cell array of vectors, named \% 'link_vectors' (although this is a planar arm, to make the Jacobian work correctly, the component of each link needs to be set to zero specify joint angles as a vector, named 'joint_angles' Specify joint axes as a cell array of ' ' values \%\%\%\%\%\% \% Create an empty cell array of the same size as link_vectors, named J \%\%\%\%\% Loop over the elements of J