Home /
Expert Answers /
Computer Science /
nbsp-nbsp-nbsp-figure-3-shows-an-image-of-a-circle-with-the-radius-and-a-tangent-line-pa442
(Solved): Figure 3 shows an image of a circle, with the radius and a tangent line ...
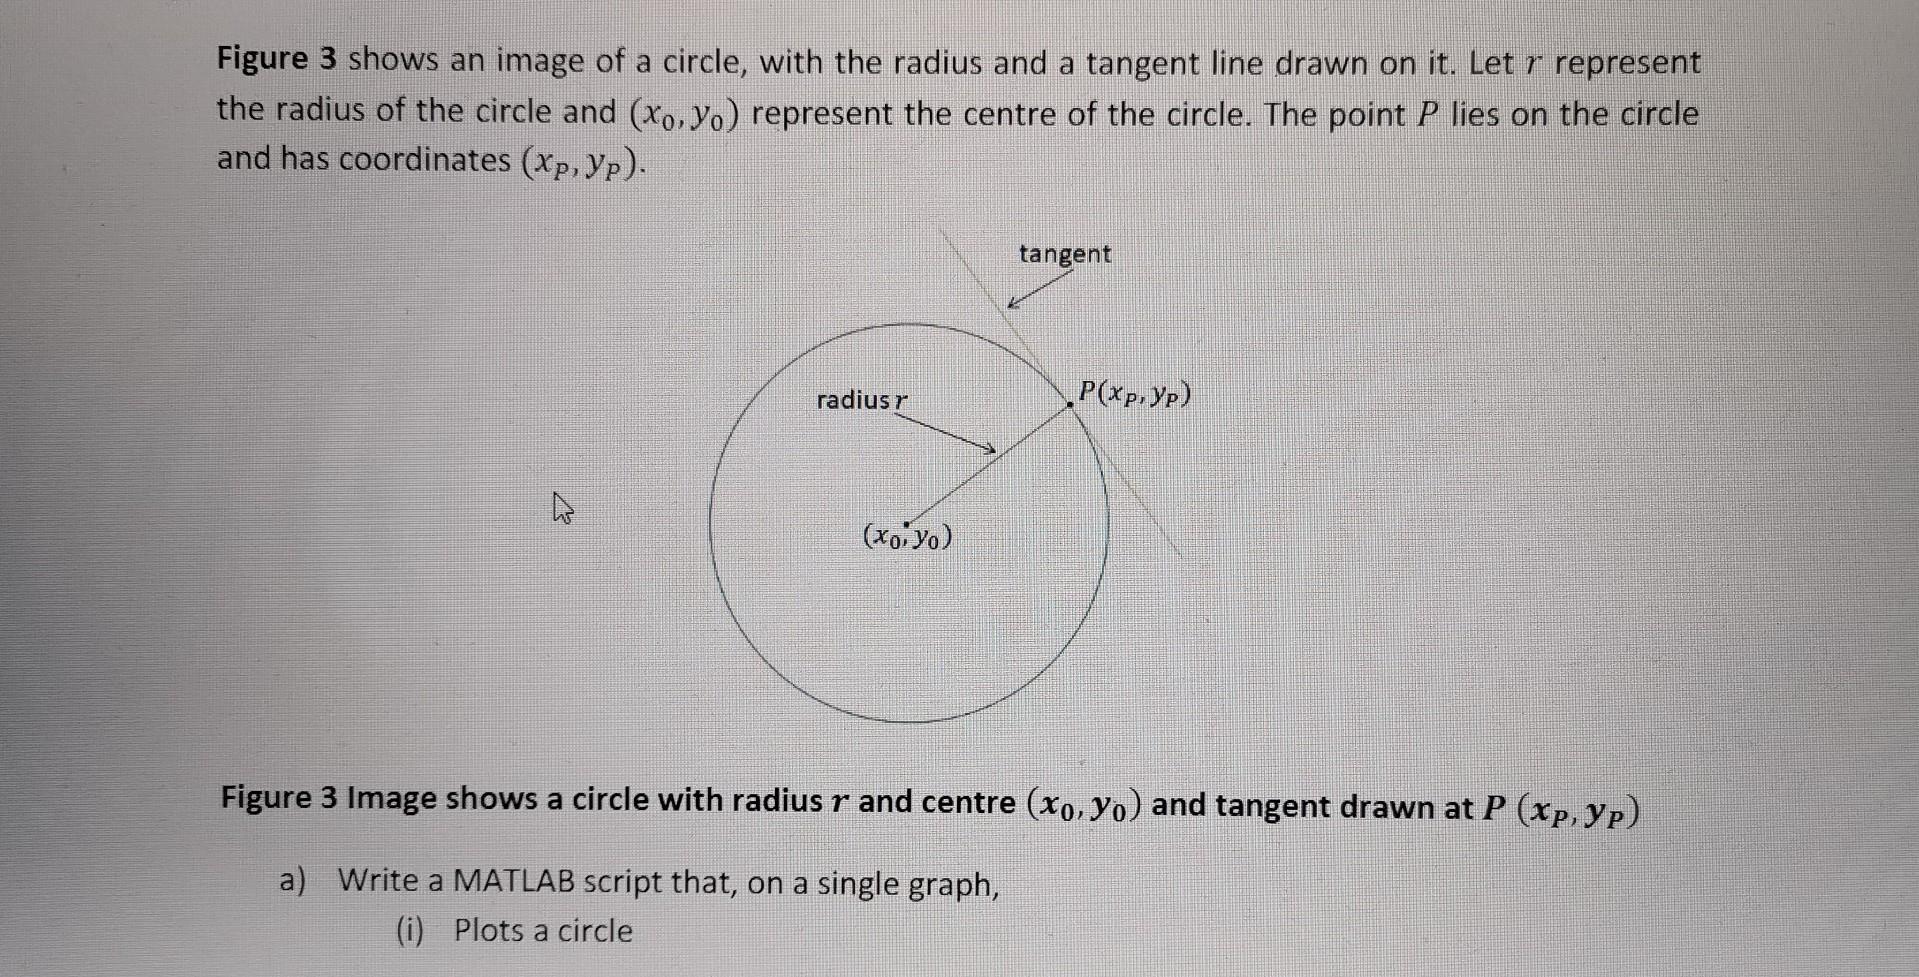
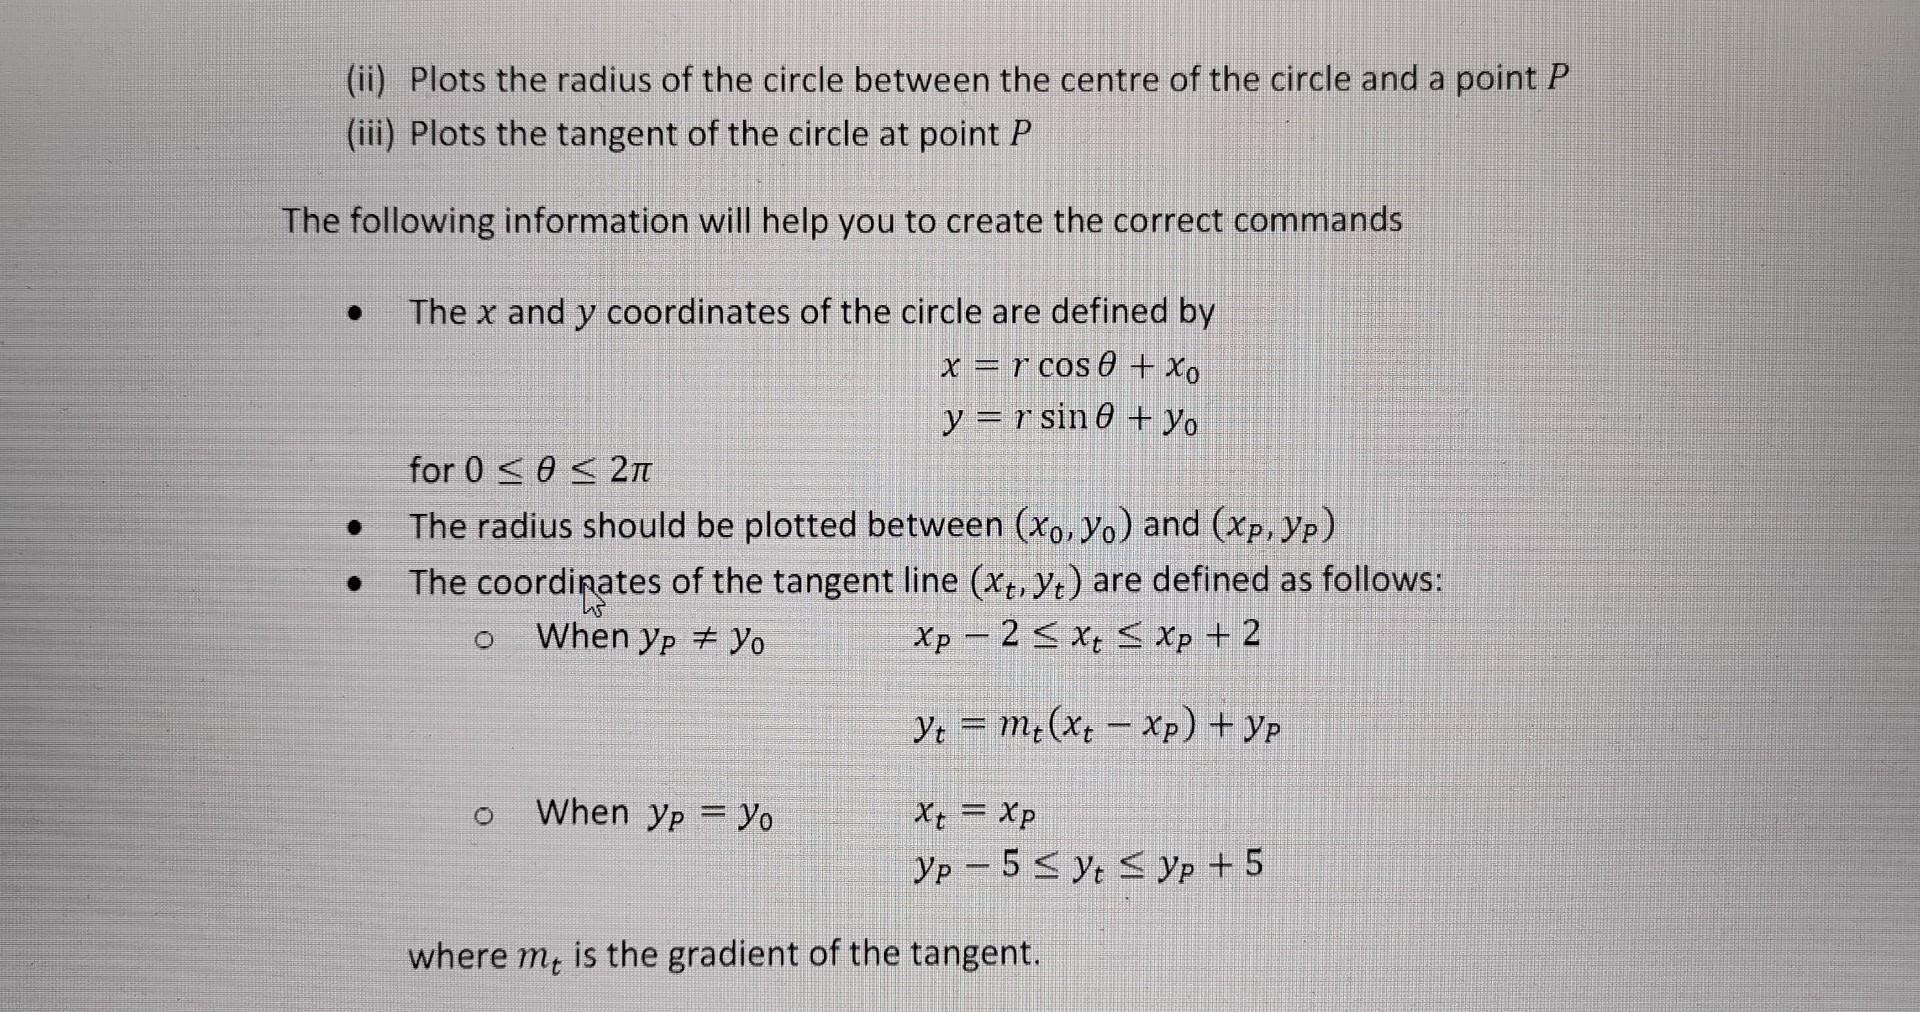
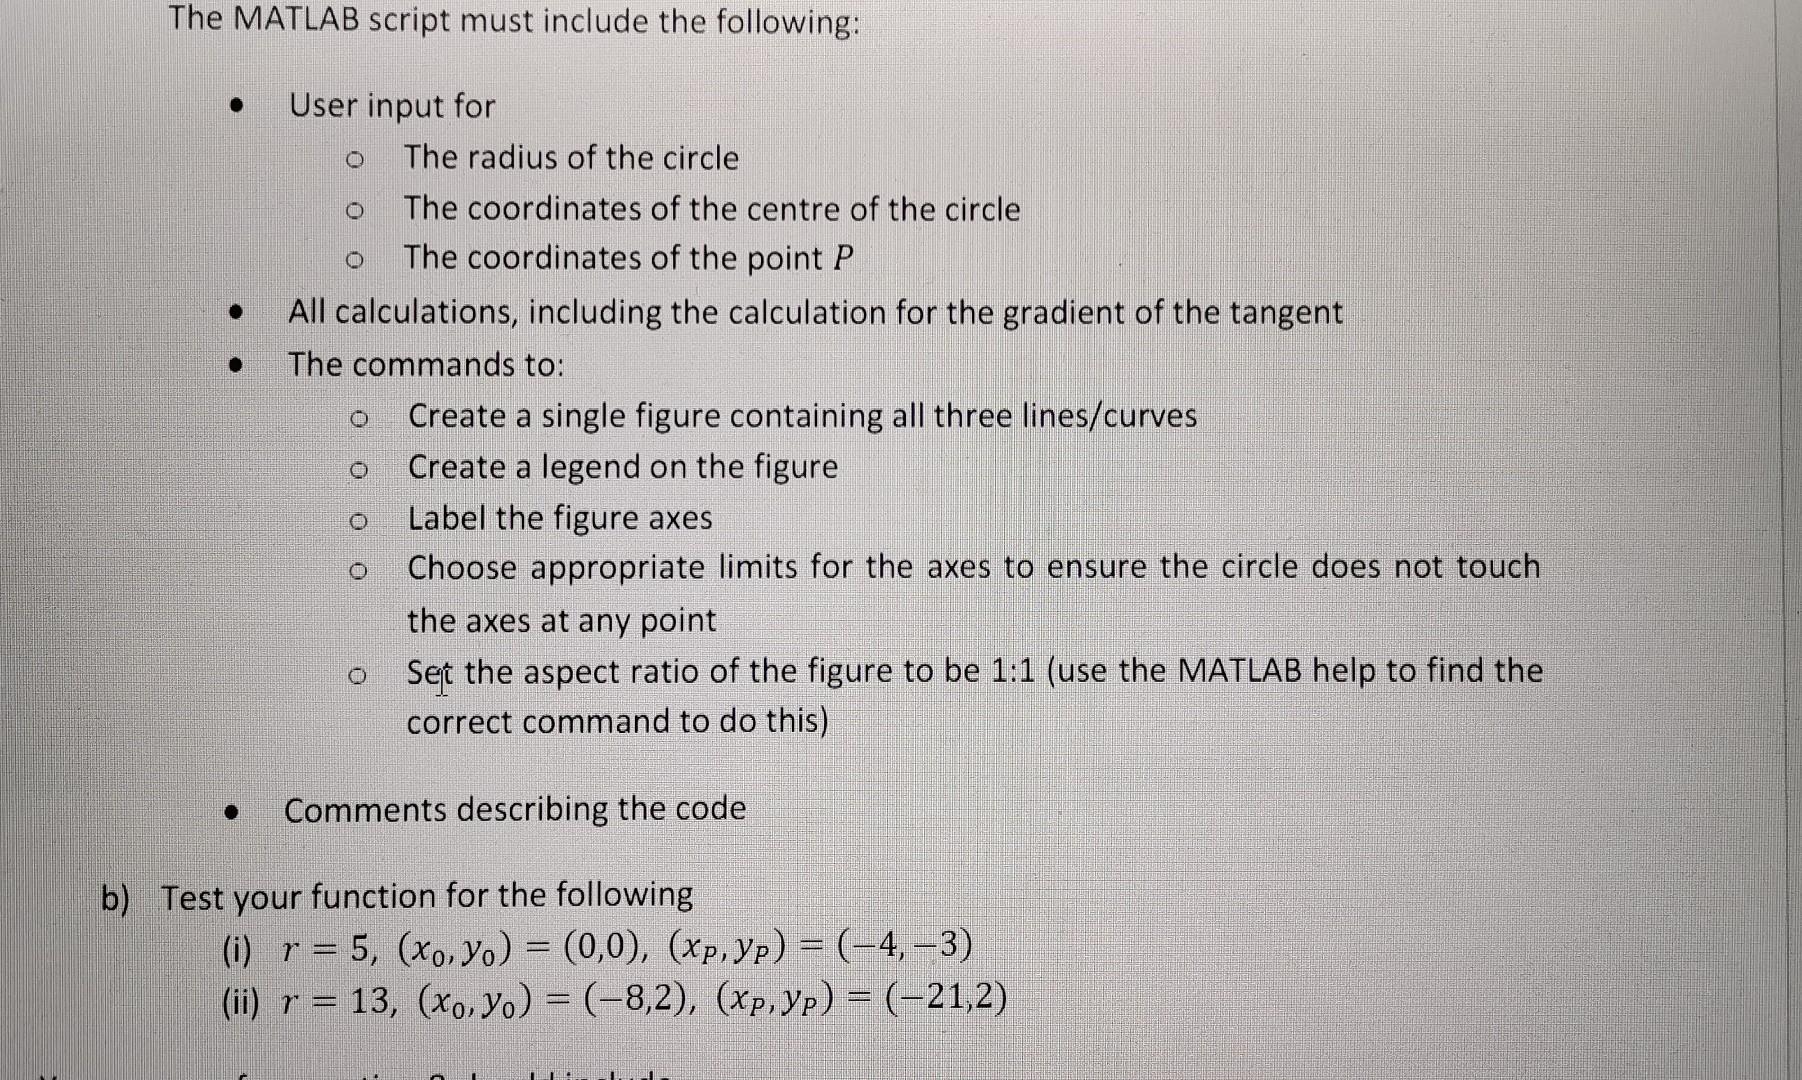
Figure 3 shows an image of a circle, with the radius and a tangent line drawn on it. Let \( r \) represent the radius of the circle and \( \left(x_{0}, y_{0}\right) \) represent the centre of the circle. The point \( P \) lies on the circle and has coordinates \( \left(x_{P}, y_{P}\right) \) Figure 3 Image shows a circle with radius \( r \) and centre \( \left(x_{0}, y_{0}\right) \) and tangent drawn at \( P\left(x_{P}, y_{P}\right) \) a) Write a MATLAB script that, on a single graph, (i) Plots a circle
(ii) Plots the radius of the circle between the centre of the circle and a point \( P \) (iii) Plots the tangent of the circle at point \( P \) The following information will help you to create the correct commands - The \( x \) and \( y \) coordinates of the circle are defined by \[ \begin{array}{ll} x=r \cos \theta+x_{0} \\ y=r \sin \theta+y_{0} \end{array} \] - The radius should be plotted between \( \left(x_{0}, y_{0}\right) \) and \( \left(x_{P}, y_{P}\right) \) - The coordipates of the tangent line \( \left(x_{t}, y_{t}\right) \) are defined as follows: \[ \begin{array}{ll} \text { When } y_{P} \neq y_{0} & x_{P}-2 \leq x_{t} \leq x_{P}+2 \\ \text { When } y_{P}=y_{0} & y_{t}=m_{t}\left(x_{t}-x_{P}\right)+y_{P} \\ & x_{t}=x_{P} \\ & y_{P}-5 \leq y_{t} \leq y_{P}+5 \end{array} \] where \( m_{t} \) is the gradient of the tangent.
The MATLAB script must include the following: - User input for The radius of the circle The coordinates of the centre of the circle The coordinates of the point \( P \) - All calculations, including the calculation for the gradient of the tangent - The commands to: Create a single figure containing all three lines/curves Create a legend on the figure Label the figure axes Choose appropriate limits for the axes to ensure the circle does not touch the axes at any point Set the aspect ratio of the figure to be \( 1: 1 \) (use the MATLAB help to find the correct command to do this) - Comments describing the code b) Test your function for the following (i) \( r=5,\left(x_{0}, y_{0}\right)=(0,0),\left(x_{P}, y_{P}\right)=(-4,-3) \) (ii) \( r=13,\left(x_{0}, y_{0}\right)=(-8,2),\left(x_{P}, y_{P}\right)=(-21,2) \)
Expert Answer
% circle , tangent and radius code in matlab % user input for radius r=input('Enter the radius of a circle: '); % user input for center C=input('Enter