Home /
Expert Answers /
Physics /
nbsp-question-3-the-figure-2-below-shows-the-angular-position-versus-time-graph-for-a-particle-pa721
(Solved): Question 3 The FIGURE 2 below shows the angular position versus time graph for a particle ...
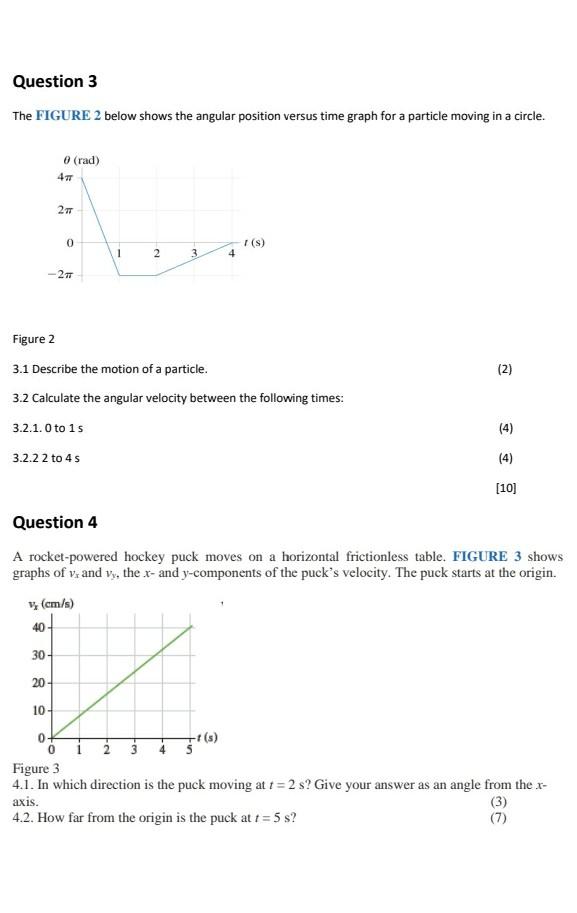
Question 3 The FIGURE 2 below shows the angular position versus time graph for a particle moving in a circle. 0 (rad) 4# 40 2T 0 0 -2T 1 2 3. Figure 2 3.1 Describe the motion of a particle. 3.2 Calculate the angular velocity between the following times: 3.2.1.0 to 1s 3.2.2 2 to 4 s 30- ? 20- 10- 4 T(S) Question 4 A rocket-powered hockey puck moves on a horizontal frictionless table. FIGURE 3 shows graphs of v. and vy, the x- and y-components of the puck's velocity. The puck starts at the origin. v, (cm/s) (2) (4) (4) [10] Figure 3 4.1. In which direction is the puck moving at t=2 s? Give your answer as an angle from the x- axis. (3) 4.2. How far from the origin is the puck at t = 5 s? (7)