Home /
Expert Answers /
Statistics and Probability /
need-answers-work-shown-1-the-following-data-table-is-obtained-by-a-fourth-grader-on-his-science-pa701
(Solved): need answers + work shown 1. The following data table is obtained by a fourth grader on his science ...
need answers + work shown
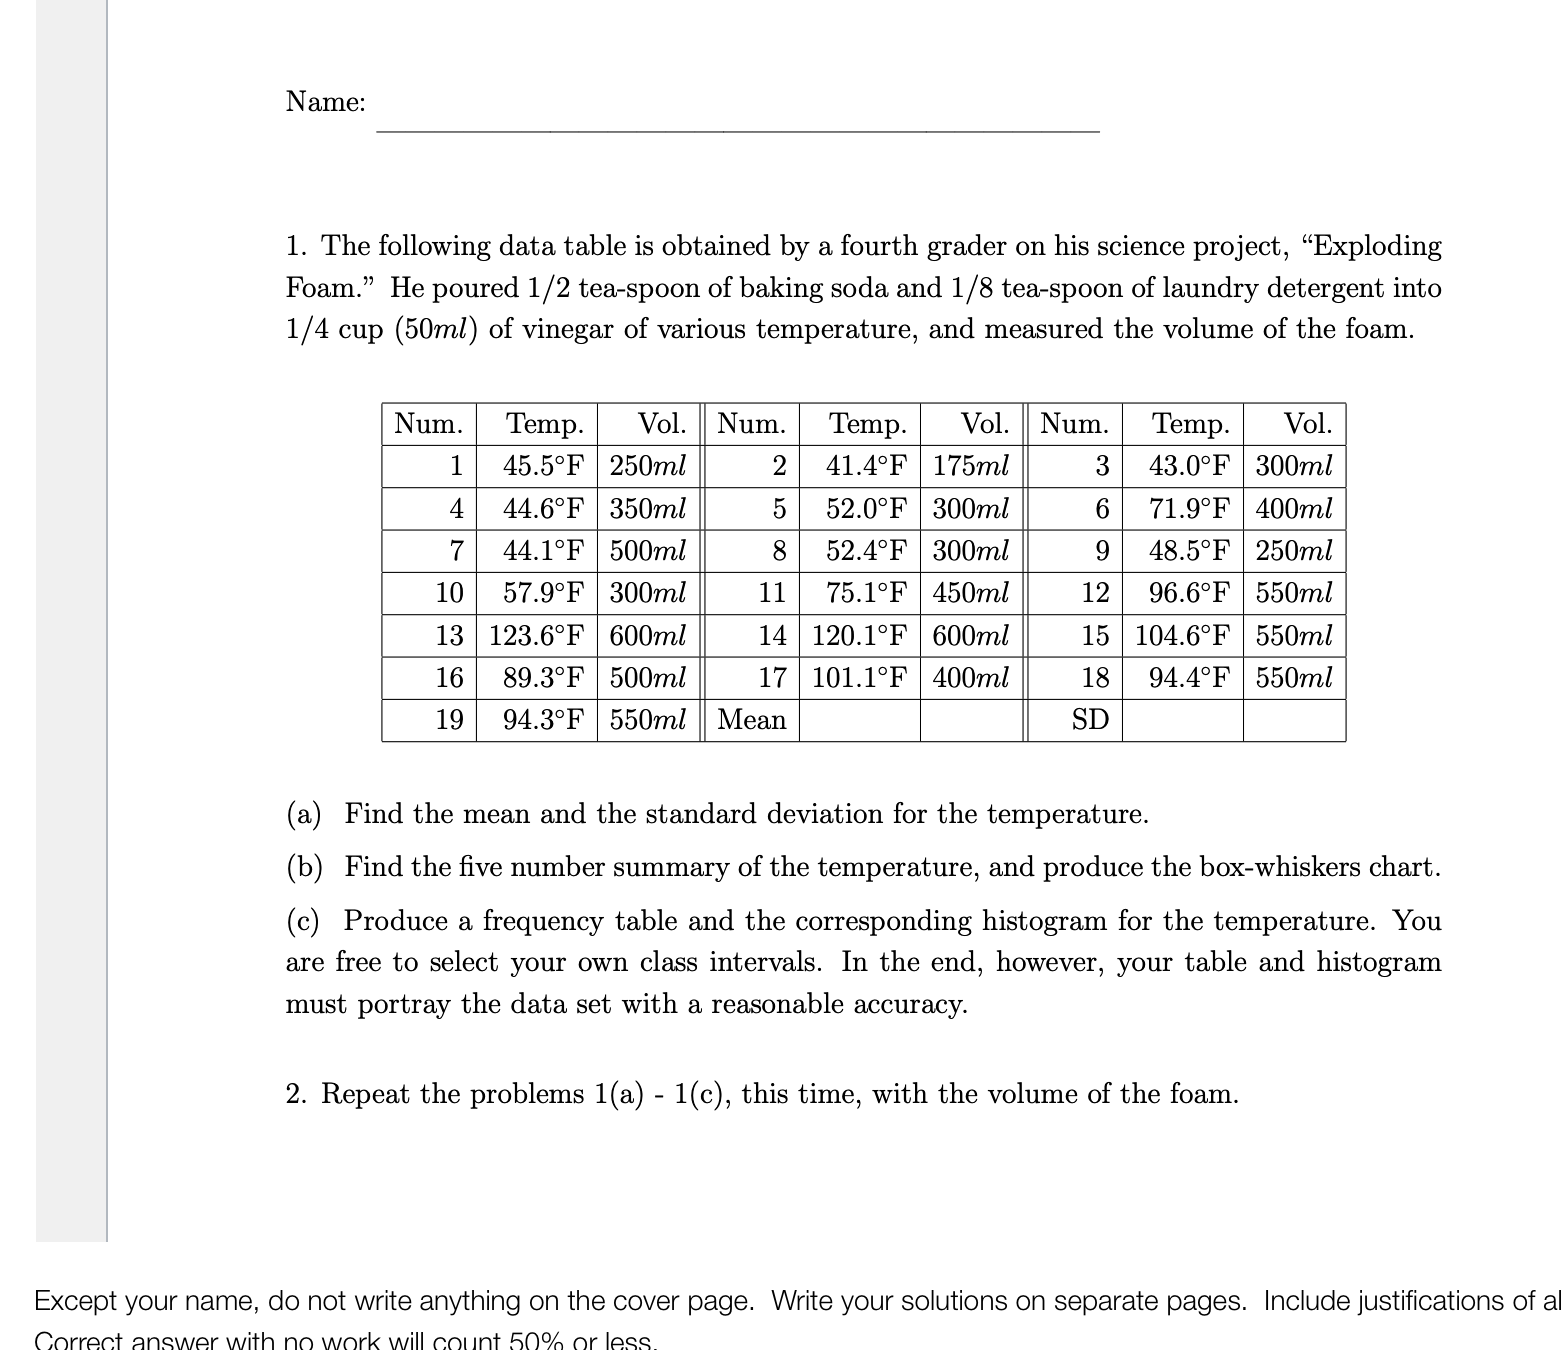
1. The following data table is obtained by a fourth grader on his science project, "Exploding Foam." He poured 1/2 tea-spoon of baking soda and 1/8 tea-spoon of laundry detergent into cup of vinegar of various temperature, and measured the volume of the foam. (a) Find the mean and the standard deviation for the temperature. (b) Find the five number summary of the temperature, and produce the box-whiskers chart. (c) Produce a frequency table and the corresponding histogram for the temperature. You are free to select your own class intervals. In the end, however, your table and histogram must portray the data set with a reasonable accuracy. 2. Repeat the problems , this time, with the volume of the foam. Except your name, do not write anything on the cover page. Write your solutions on separate pages. Include justifications of a
Expert Answer
Note: Since you have asked multiple questions, we still solve the first question for you. If you w...